Smart Agriculture Environmental Monitoring Design Guide
A comprehensive engineering reference for procurement, implementation, delivery, and operations of smart agriculture environmental monitoring systems — covering greenhouses, open fields, orchards, pastures, and aquaculture.
System Overview
The Smart Agriculture Environmental Monitoring System is a comprehensive engineering platform designed for facilities agriculture (greenhouses, tunnels), open-field cultivation, orchards and tea gardens, pastures, and aquaculture operations. It performs continuous monitoring and data governance over weather, soil, crop microclimate, and facility/equipment state, forming a closed loop of multi-point sensing → edge control → platform analytics → alarm linkage → farming operations feedback.
This guide is intended for EPC contractors, system integrators, and farm-owner self-build projects. It covers the complete engineering lifecycle from site survey and architecture design through sensor selection, installation, commissioning, and long-term operations and maintenance. The system is designed to operate across a wide environmental envelope: ambient temperatures from -20°C to +55°C, relative humidity from 10% to 100%, wind speeds up to 35 m/s, and full exposure to heavy rainfall and storm conditions.
Core Value: The system's "engine" is not just sensors — it is representative placement, calibration and maintenance discipline, data validity labeling, and operable alarms that reduce false actions and enable trustworthy decisions that drive measurable improvements in resource use and crop outcomes.
Positioning & Goals
The system provides a reliable and maintainable sensing-and-control foundation for precision irrigation and fertigation, disease and pest risk early warning, extreme weather response, and yield and quality improvement. By delivering actionable alarms, validated data, and farm-task closure (who did what, when, with evidence), it reduces resource waste and operating cost while improving traceability and compliance.
Applicability & Boundaries
- Applicable to distributed outdoor and indoor agriculture sites with multi-point sensing, supporting both monitoring-only and monitoring-plus-control configurations.
- Covers sensors through edge devices, platform software, alarms, and third-party integration — but does not prescribe crop models for every species; it provides engineering hooks to plug models in.
- Not applicable to purely laboratory research systems requiring sub-second scientific instruments, or to safety-critical industrial control requiring SIL certification beyond typical agricultural automation.
System Architecture
The overall system architecture follows a layered design from the physical sensing environment through edge processing, communications, platform services, and application integration. Each layer has clearly defined responsibilities, interfaces, and quality boundaries. The architecture supports deployments ranging from small single-farm installations (30–100 monitoring points) to large multi-farm, multi-tenant operations with 1,000–10,000+ points.
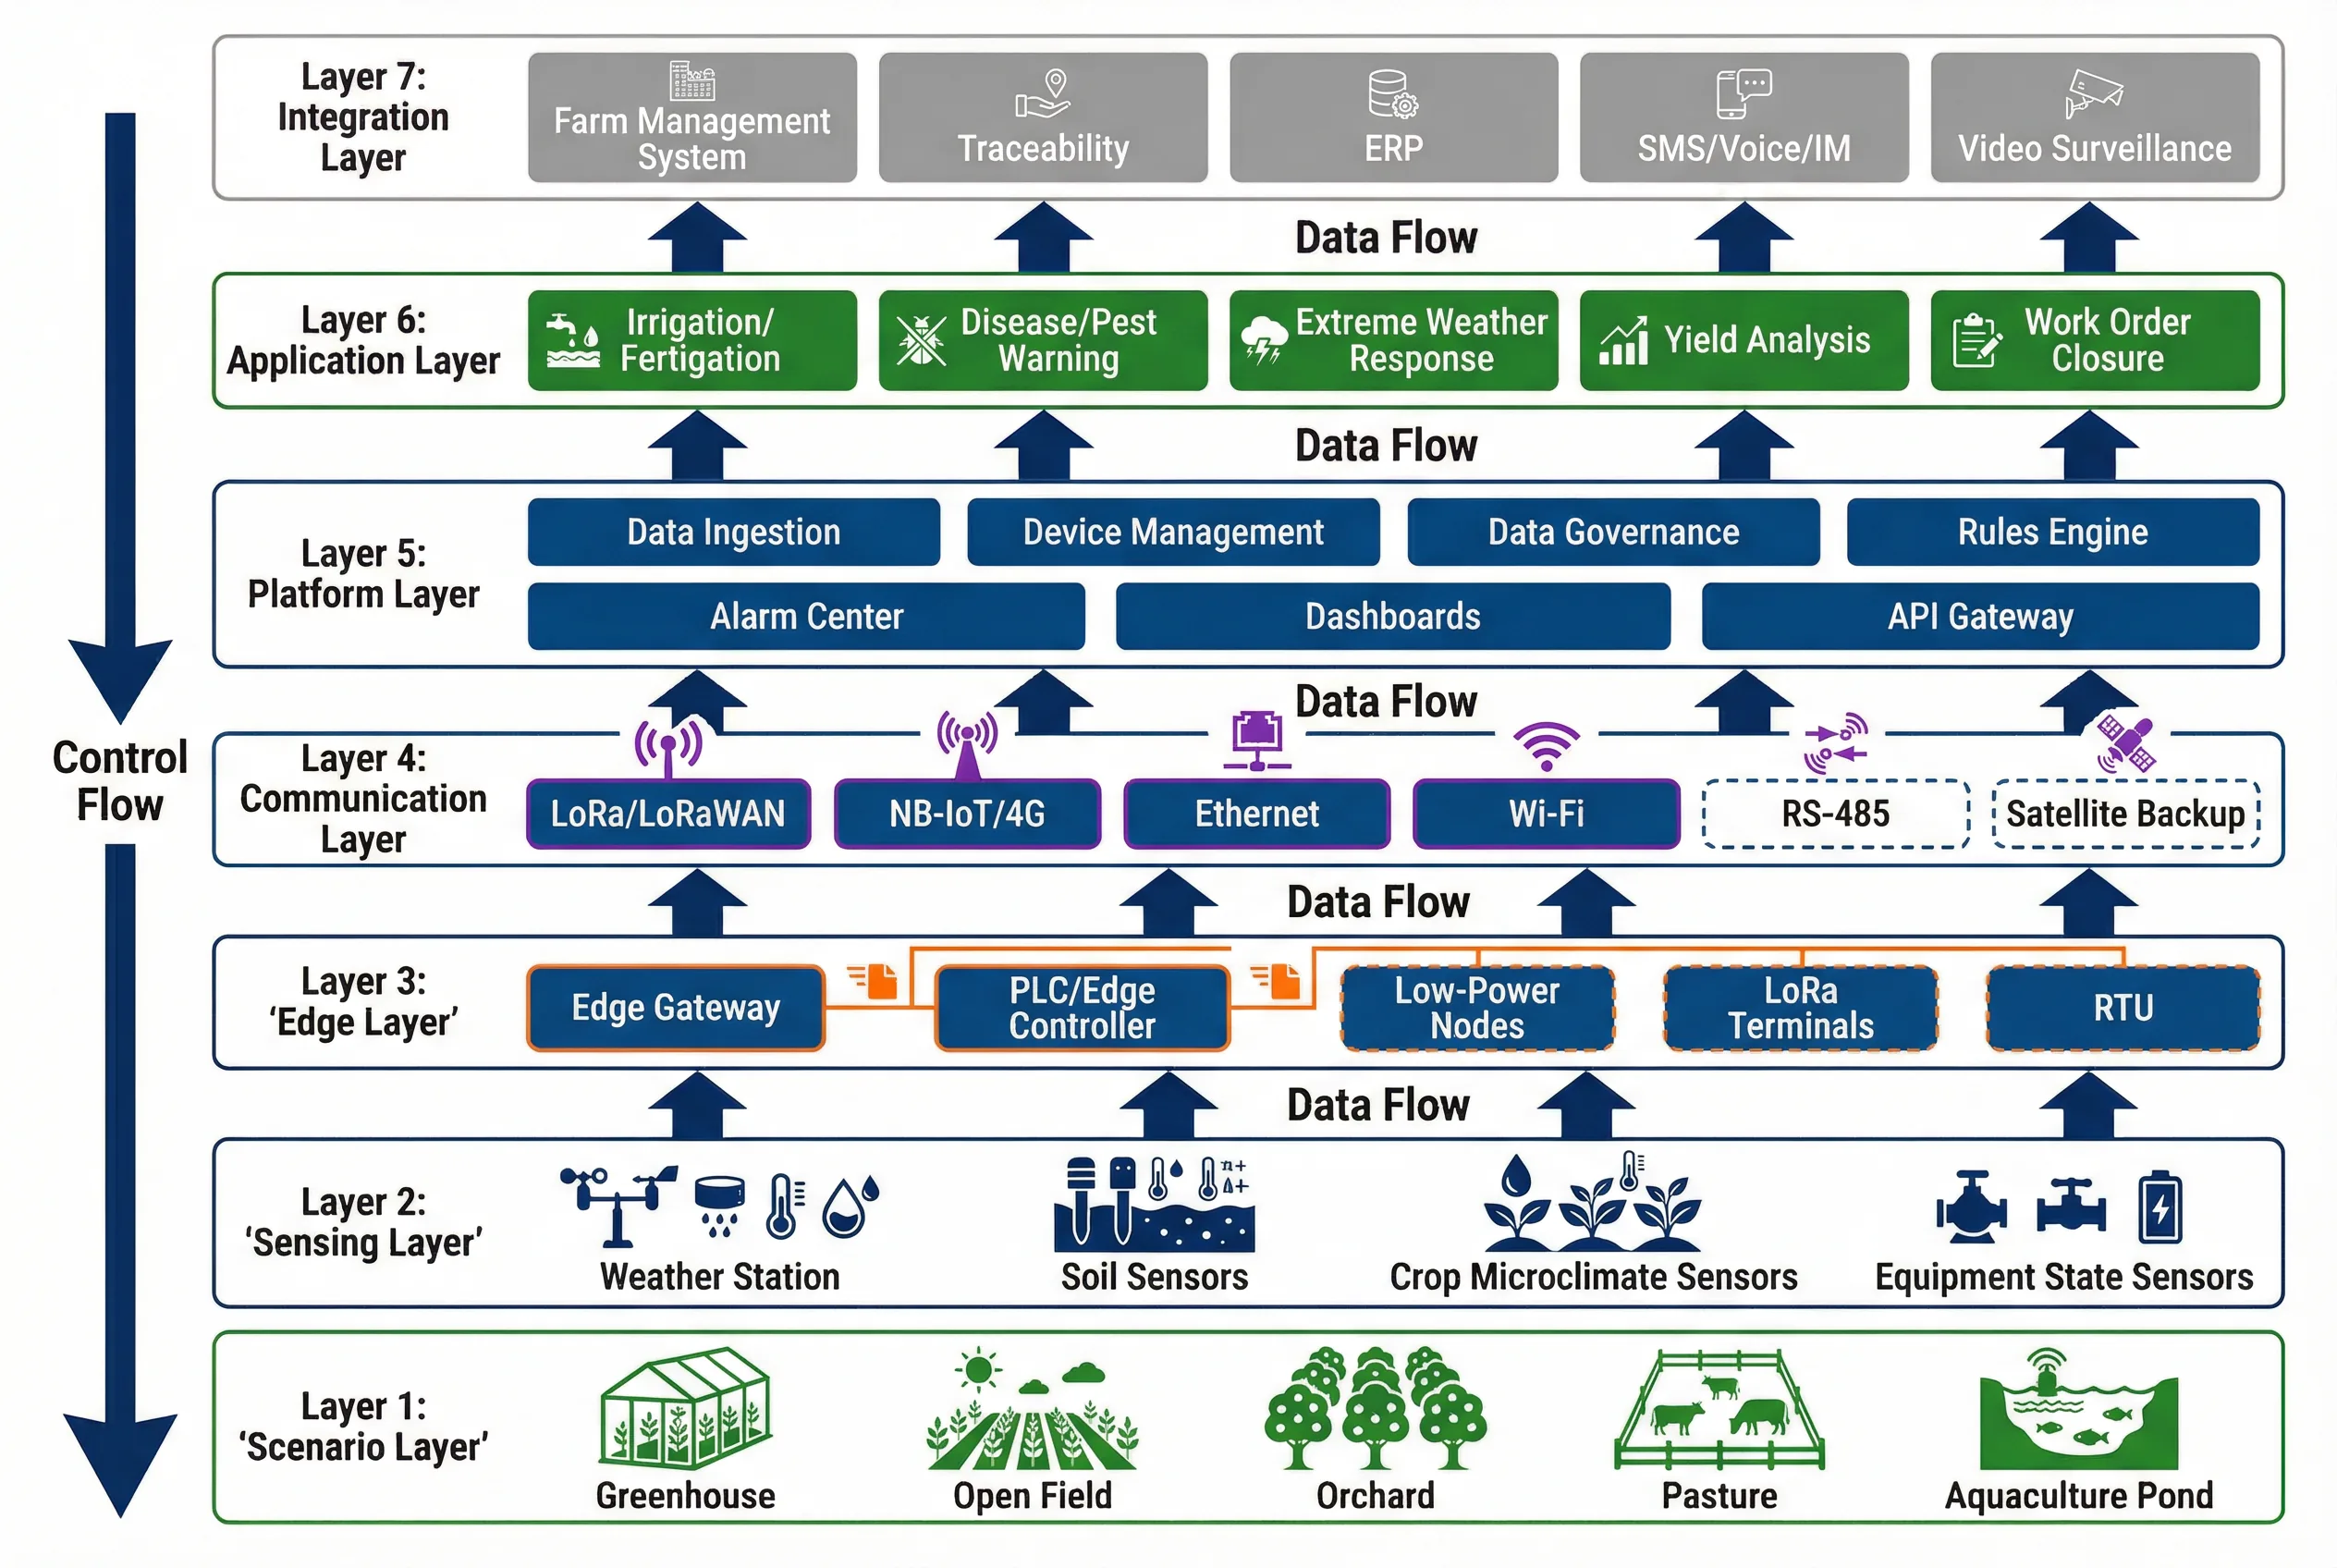
Figure 0.1: Smart Agriculture Environmental Monitoring System — Overall Architecture (7-Layer Diagram)
The architecture distinguishes between core components (sensing, edge, platform ingestion, QC flags, alarms, dashboards), optional enhancements (AI pest models, satellite backup, video analytics, advanced optimization), and supporting dependencies (network, UPS, power distribution, lightning grounding, cabinet infrastructure, fire linkage, physical security). This separation allows projects to start with the core and add capabilities incrementally without redesigning the foundation.
Key Data and Control Flows
- Data flow (upward): Sensor → edge normalization and QC → platform ingestion → time-series storage → analytics and rules → dashboards and reports.
- Control flow (downward): Platform recommendations → edge command with safety constraints → actuator → feedback telemetry.
- Alarm linkage: Rules engine → multi-channel notifications → work order → evidence closure.
Main Functions
The platform delivers nine primary functional capabilities, each designed to convert raw sensor data into actionable farm operations. The diagram below presents these functions in a nine-grid overview, showing the input, processing logic, and output for each capability.
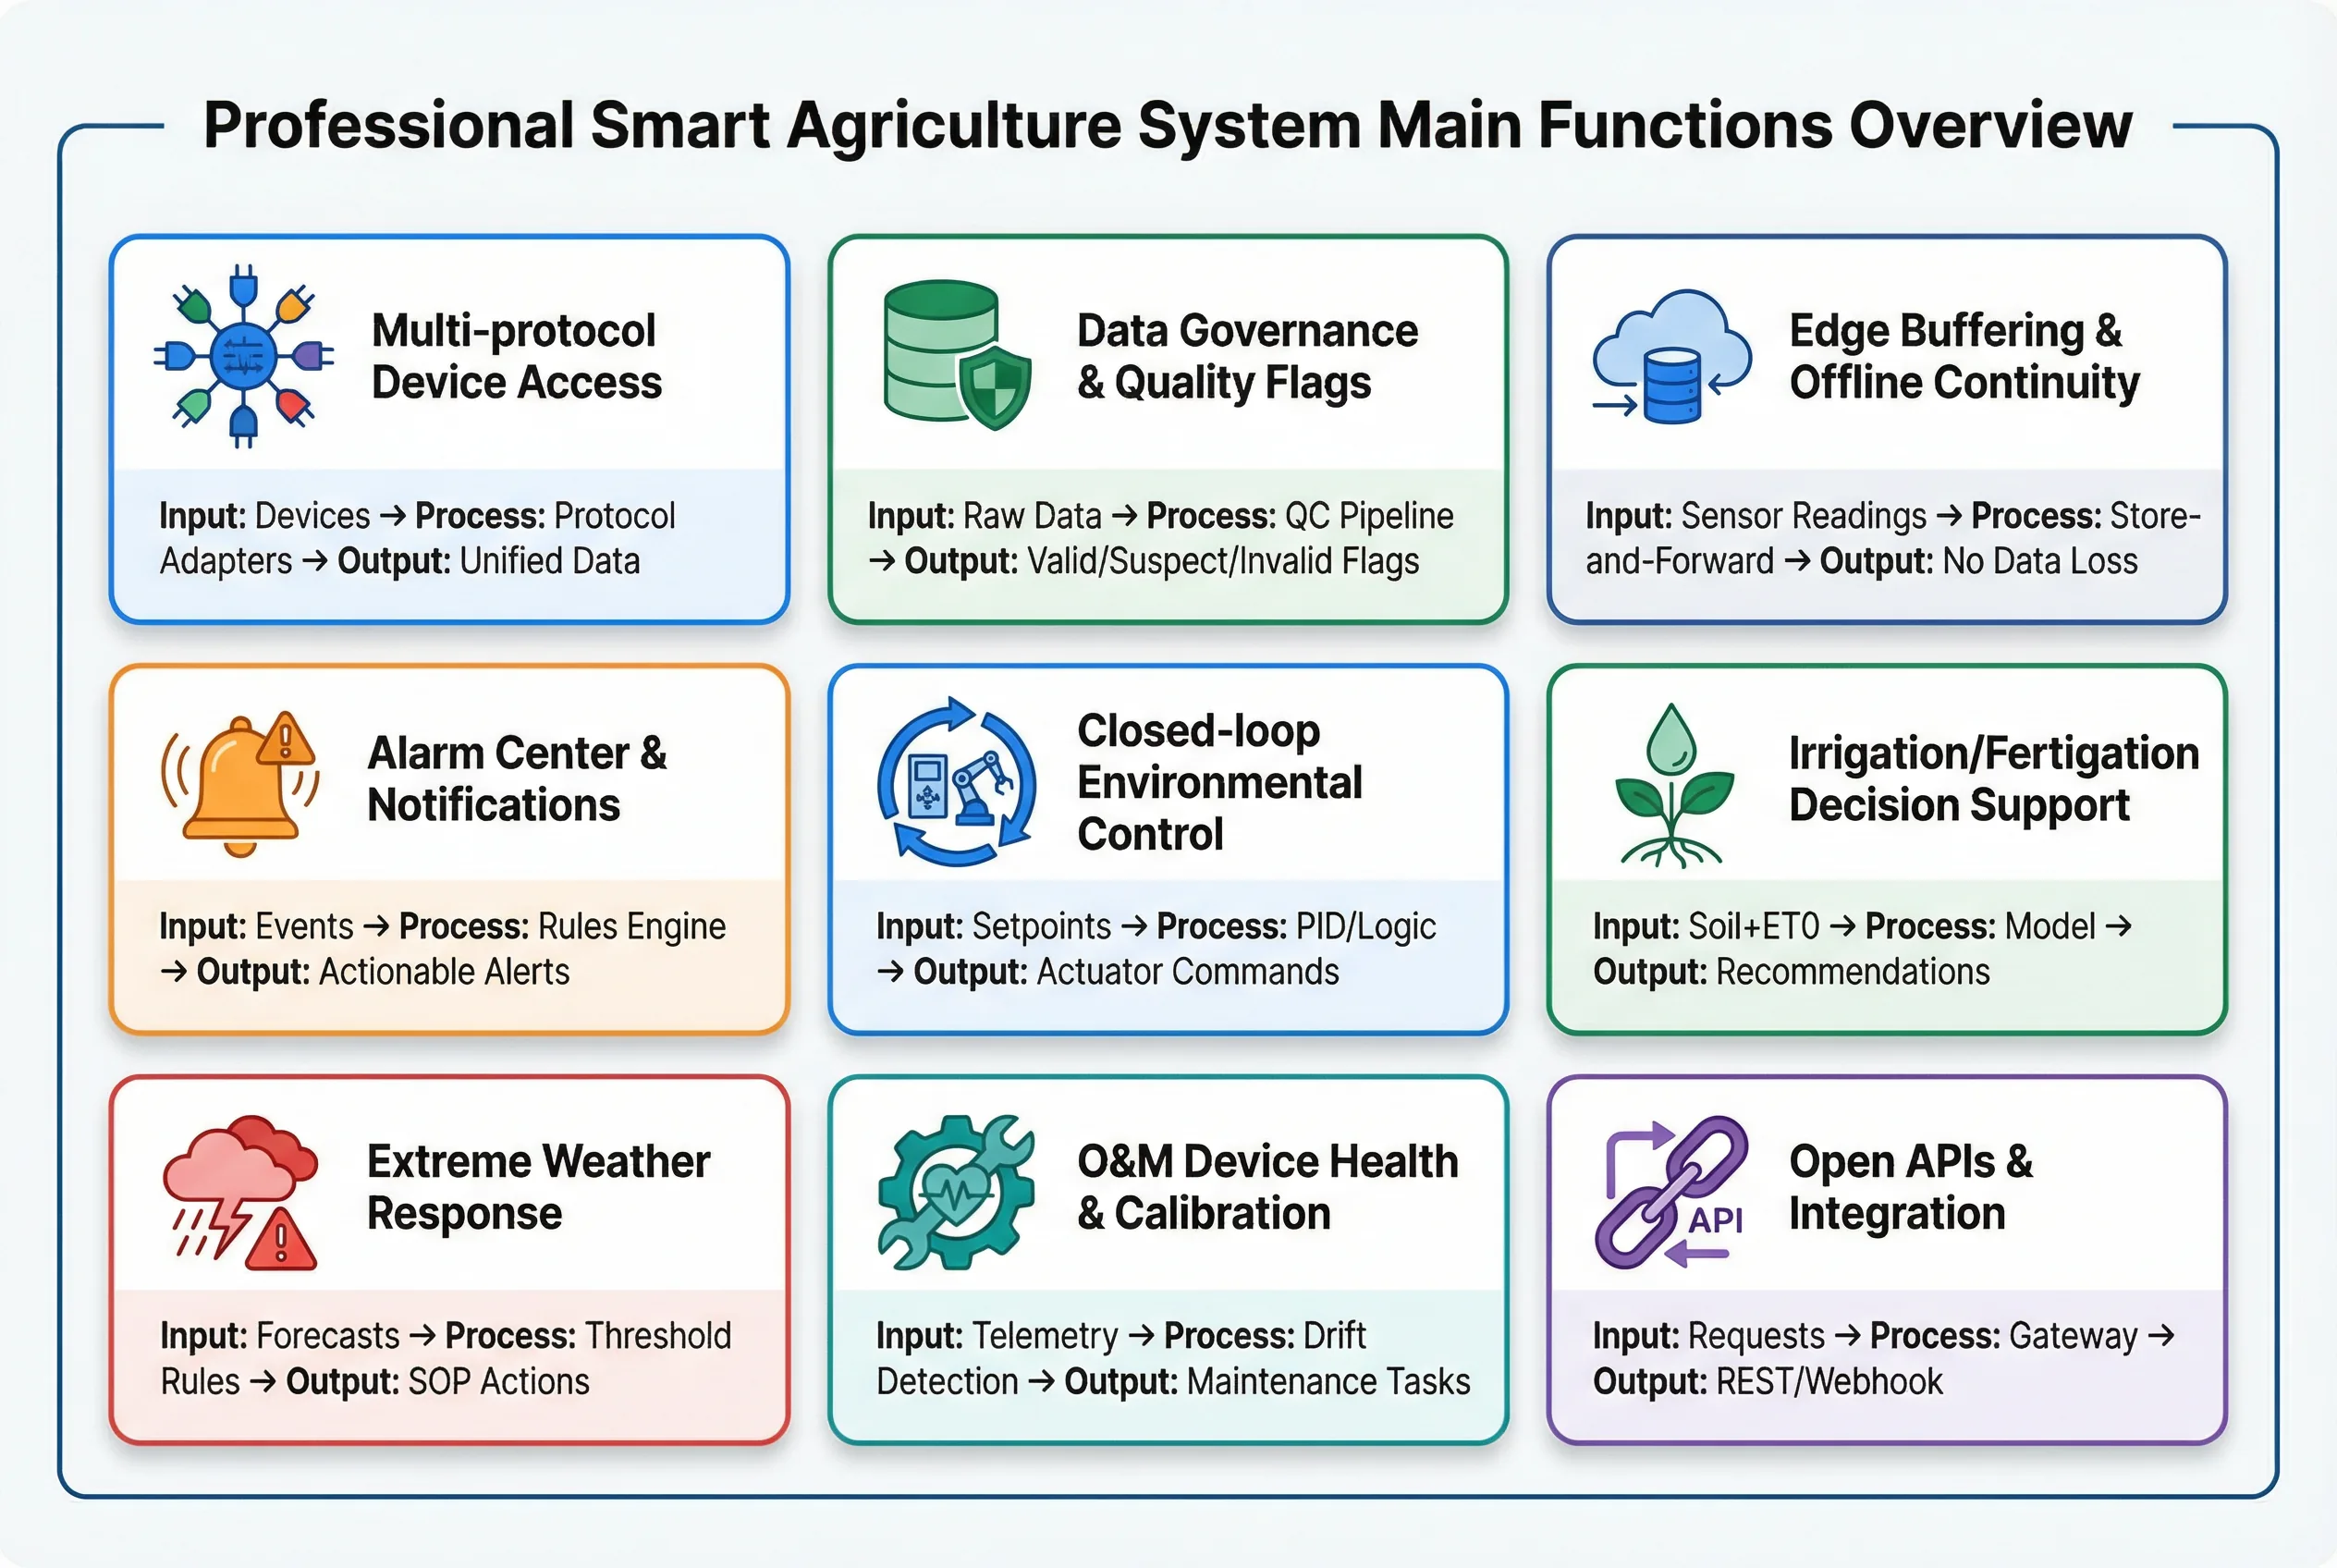
Figure 0.2: Main System Functions Overview — Nine-Grid Capability Map
| Function | Core Value | Key Implementation | Acceptance Focus |
|---|---|---|---|
| Multi-protocol Device Access | Reduces vendor lock-in; accelerates rollout | MQTT/HTTP/CoAP/LoRaWAN NS, Modbus RTU/TCP; unified device model | Onboarding time, telemetry completeness, retry behavior |
| Data Governance & Quality Flags | Prevents wrong irrigation/fertilization decisions | Range checks, ROC checks, redundancy cross-check, calibration tracking | QC flag correctness on seeded fault cases; auditability |
| Edge Buffering & Offline Continuity | Avoids data loss during outages | Local store-and-forward; local rule fallback; time sync strategy | Outage simulation with recovery; data gap limits |
| Alarm Center & Actionable Notifications | Turns data into operations; reduces alarm fatigue | Rule templates by scenario; severity, dedup, escalation, suppression windows | False alarm rate, MTTA, closure evidence |
| Closed-loop Environmental Control | Stabilizes greenhouse climate; improves quality | Edge PID/logic constraints; safe mode; manual override | Response time, overshoot limits, safety interlocks |
| Irrigation/Fertigation Decision Support | Saves water/fertilizer; improves yield | Soil moisture + ET0 + crop stage + irrigation capacity model | Measurable reduction, recommendation correctness |
| Extreme Weather Response Playbooks | Reduces loss from frost, heat, wind, hail | Threshold rules + forecast ingestion; SOP linkage | Drill test; response timelines |
| O&M: Device Health & Calibration | Keeps data trustworthy long-term | Battery health, comm quality, sensor drift detection, maintenance schedules | MTBF improvement, calibration compliance rate |
| Open APIs & Integration | Connects to farm management, traceability, ERP | REST/Webhook, MQTT topics, event schema, RBAC | API SLA, security controls, integration test cases |
Chapter Navigation
This guide is organized into twelve chapters covering the complete engineering lifecycle. Use the cards below or the left sidebar to navigate to any chapter.
Typical Project Deliverables
A complete smart agriculture environmental monitoring project should produce the following engineering deliverables, which serve as both acceptance criteria and long-term O&M references.
- Site survey report and monitoring point map (with GPS coordinates, zone assignments, and depth specifications)
- System architecture and network plan (topology diagram, IP addressing, VLAN design)
- Bill of Materials (BOM) and interface specifications (connector types, protocols, calibration requirements)
- Installation drawings (sensor placement, cable routing, cabinet layout, grounding plan)
- Acceptance test plan (functional tests, seeded fault scenarios, outage simulation)
- Calibration SOP (per sensor type, frequency, tools, and pass/fail criteria)
- Alarm rules configuration (thresholds, severity, escalation paths, suppression windows)
- O&M playbook (inspection checklists, spare parts list, troubleshooting guides)
- Training materials (installer wiring guide, operator dashboard guide, calibration hands-on)
Success Criteria: Reduced water and fertilizer usage (typically 5–20%), fewer crop losses due to extreme weather (measurable by incident reduction), and improved labor efficiency (reduced manual scouting). Budget sensitivity is high — prioritize lifecycle cost (LCC) and maintainability over premium hardware.