Chapter 1: System Components
Architecture, component inventory, working principles, and exception handling for the complete smart agriculture environmental monitoring system.
1.1 System Architecture
The system architecture defines the deployment boundaries and trust zones that separate field devices, communications infrastructure, platform services, and external integrations. Understanding these boundaries is essential for assigning responsibility, designing security controls, and planning maintenance access. The architecture supports both cloud-hosted and local data center deployments, with the edge layer providing autonomous operation during connectivity loss.
The deployment boundary diagram below illustrates the four primary zones: the Field/Greenhouse Site Zone containing all physical sensing and edge control equipment; the Communication Bearer Zone providing protocol translation and backhaul; the Platform Zone hosting data governance, analytics, and alarm services; and the External Systems Zone for third-party integrations including farm management, messaging, and weather services.
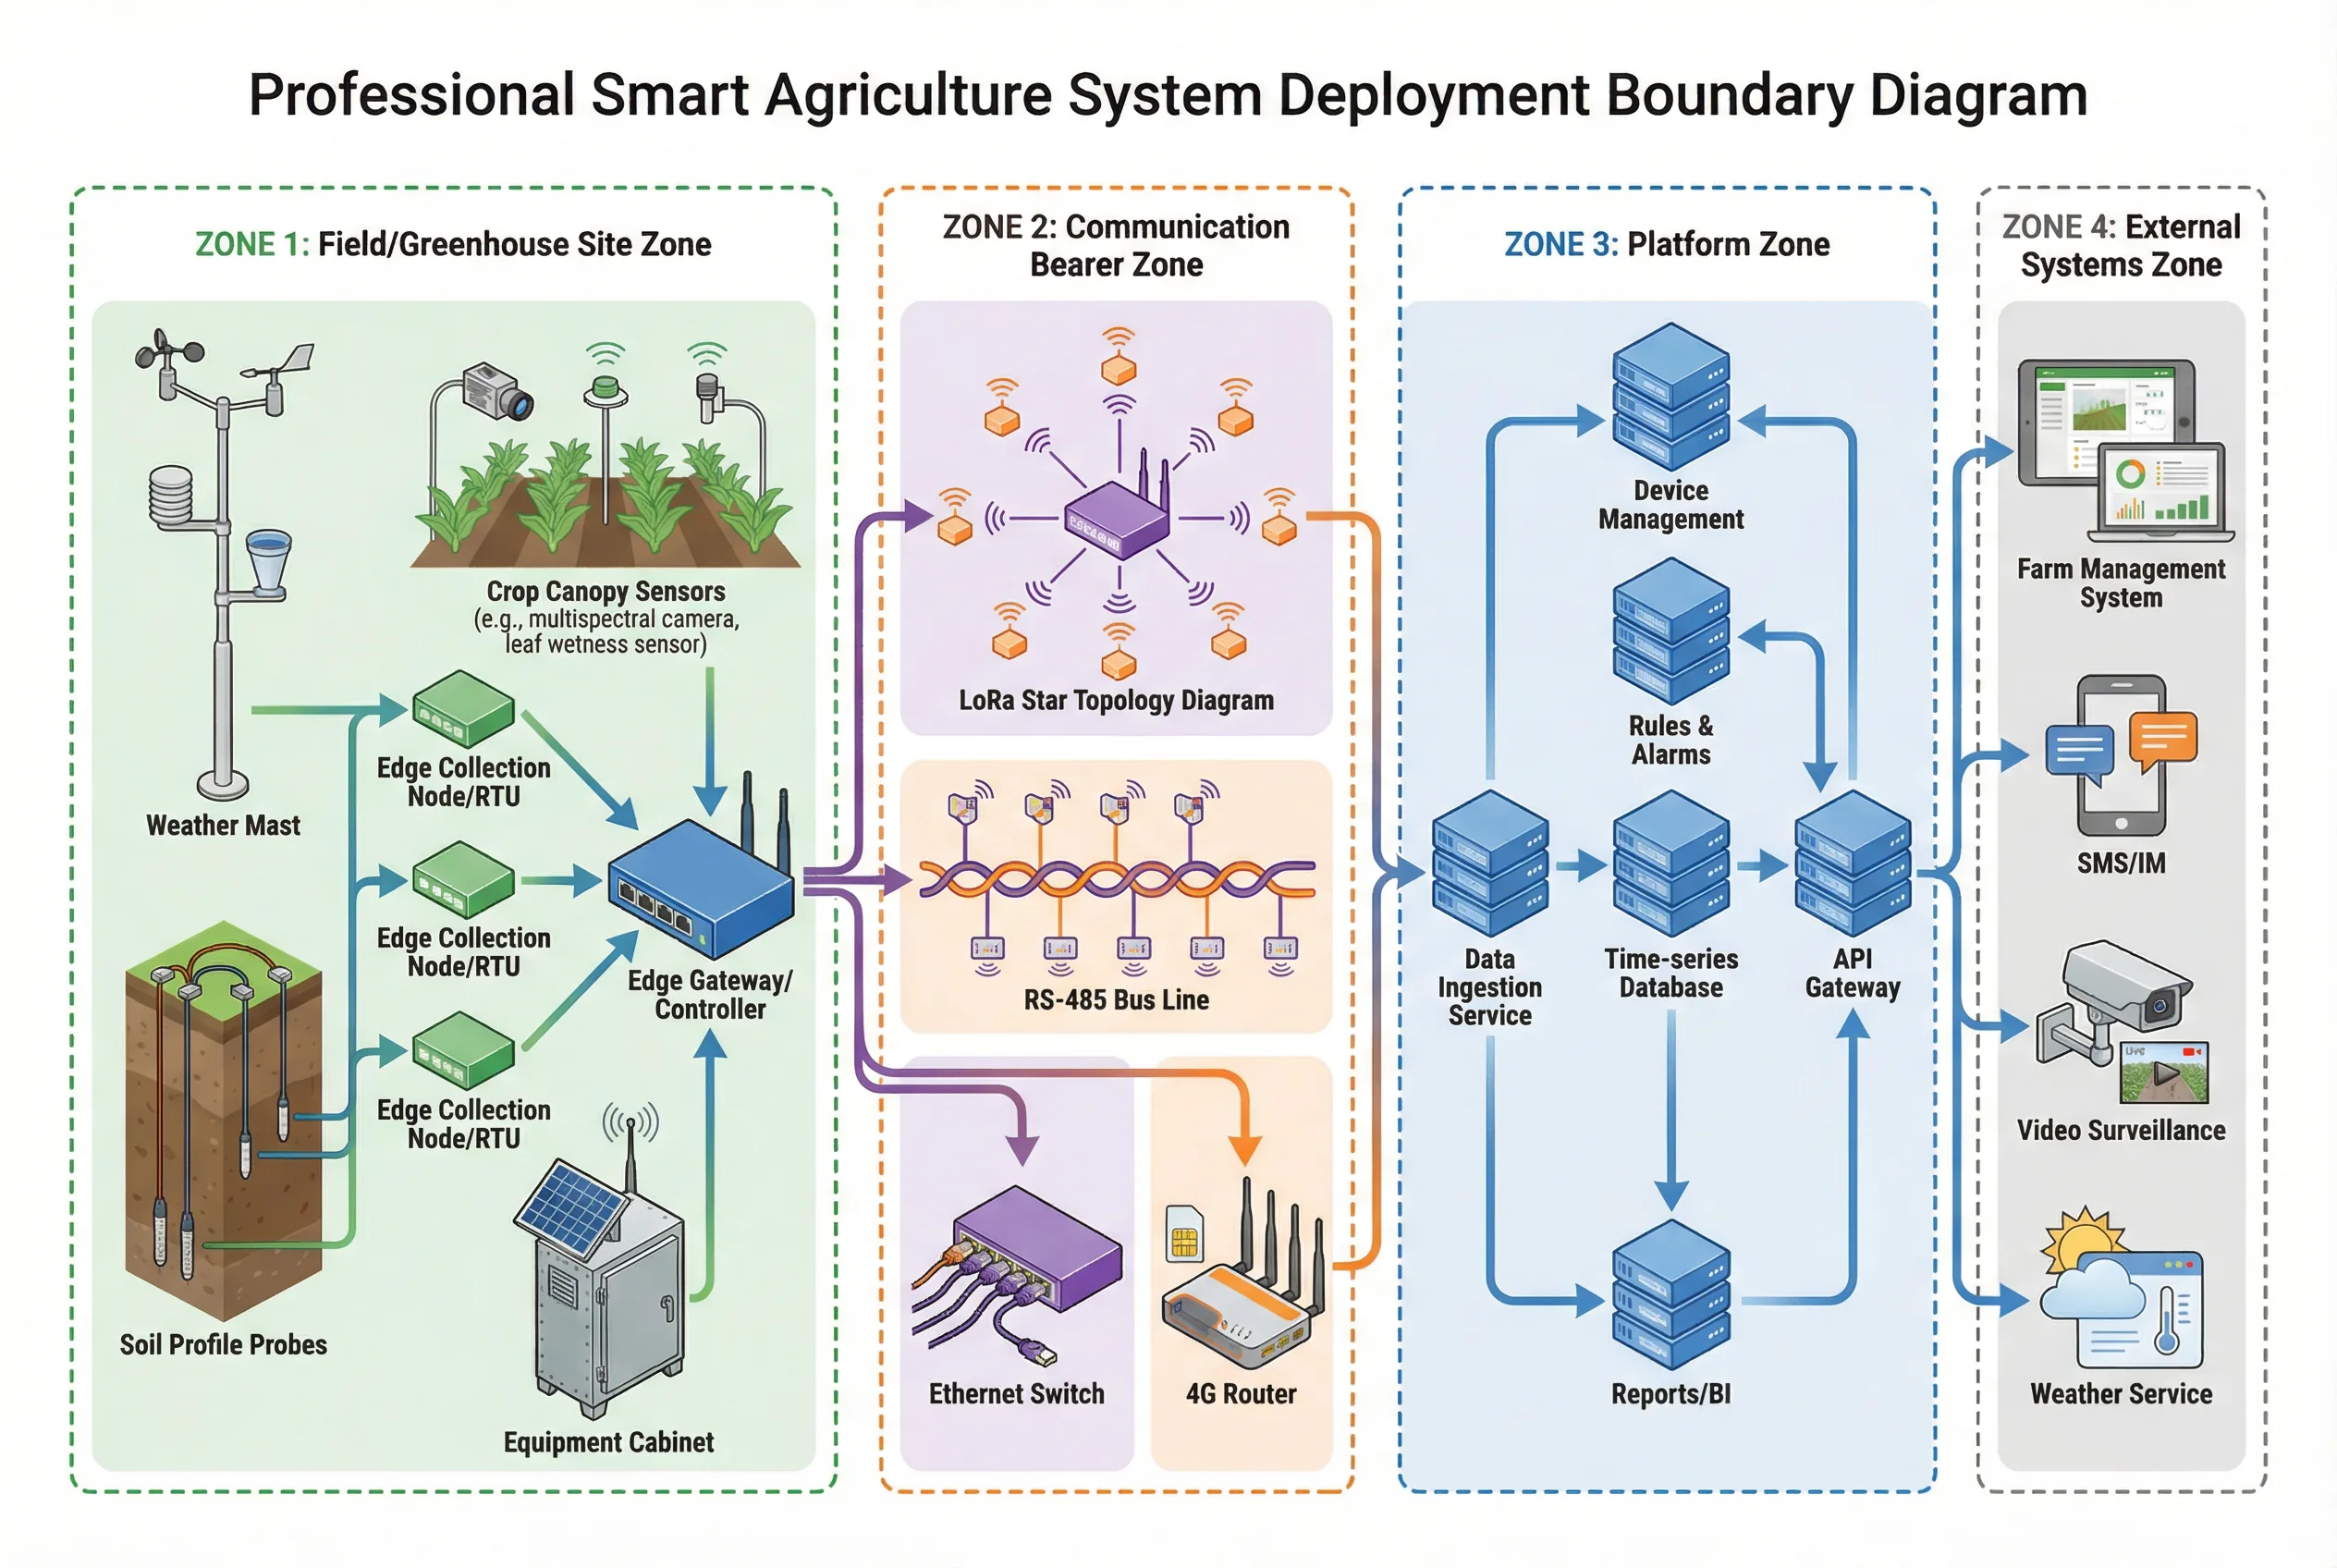
Figure 1.1: System Deployment Boundary Diagram — Four-Zone Architecture with Trust Boundaries
Module Relations & Data Flows
Sensor nodes publish measurements to edge devices via LoRa radio or RS-485 wired bus. Edge gateways normalize incoming data to MQTT or HTTPS and forward it to the platform. Control commands flow from the platform to the edge controller (or local logic) and then to actuators such as valves, fans, and screens. Data governance runs at both the edge (fast range and rate-of-change checks) and the platform (deep checks using historical context and cross-sensor comparisons).
Core vs. Optional vs. Supporting Components
| Category | Components | Justification |
|---|---|---|
| Core | Sensors, edge node/RTU, gateway/controller, data ingestion, time-series storage, QC flags, alarms, dashboard | Required for any functional deployment; without these, the system cannot deliver its primary value |
| Optional | ML pest models, video AI analytics, satellite connectivity, advanced optimization, digital twin | Adds value for specific use cases; can be added after core is stable and proven |
| Supporting | Power distribution, UPS for cabinets, lightning/grounding, cabinet/IT room, fire linkage, physical security | Infrastructure dependencies; failure here causes core system failure even if core components are correct |
1.2 Components and Functions
The component inventory spans six categories from physical sensors to platform software. Each component has defined responsibilities, inputs, outputs, key performance indicators, and typical mismatch risks. The hierarchical component diagram below provides a visual overview of all components and their relationships within the system architecture.
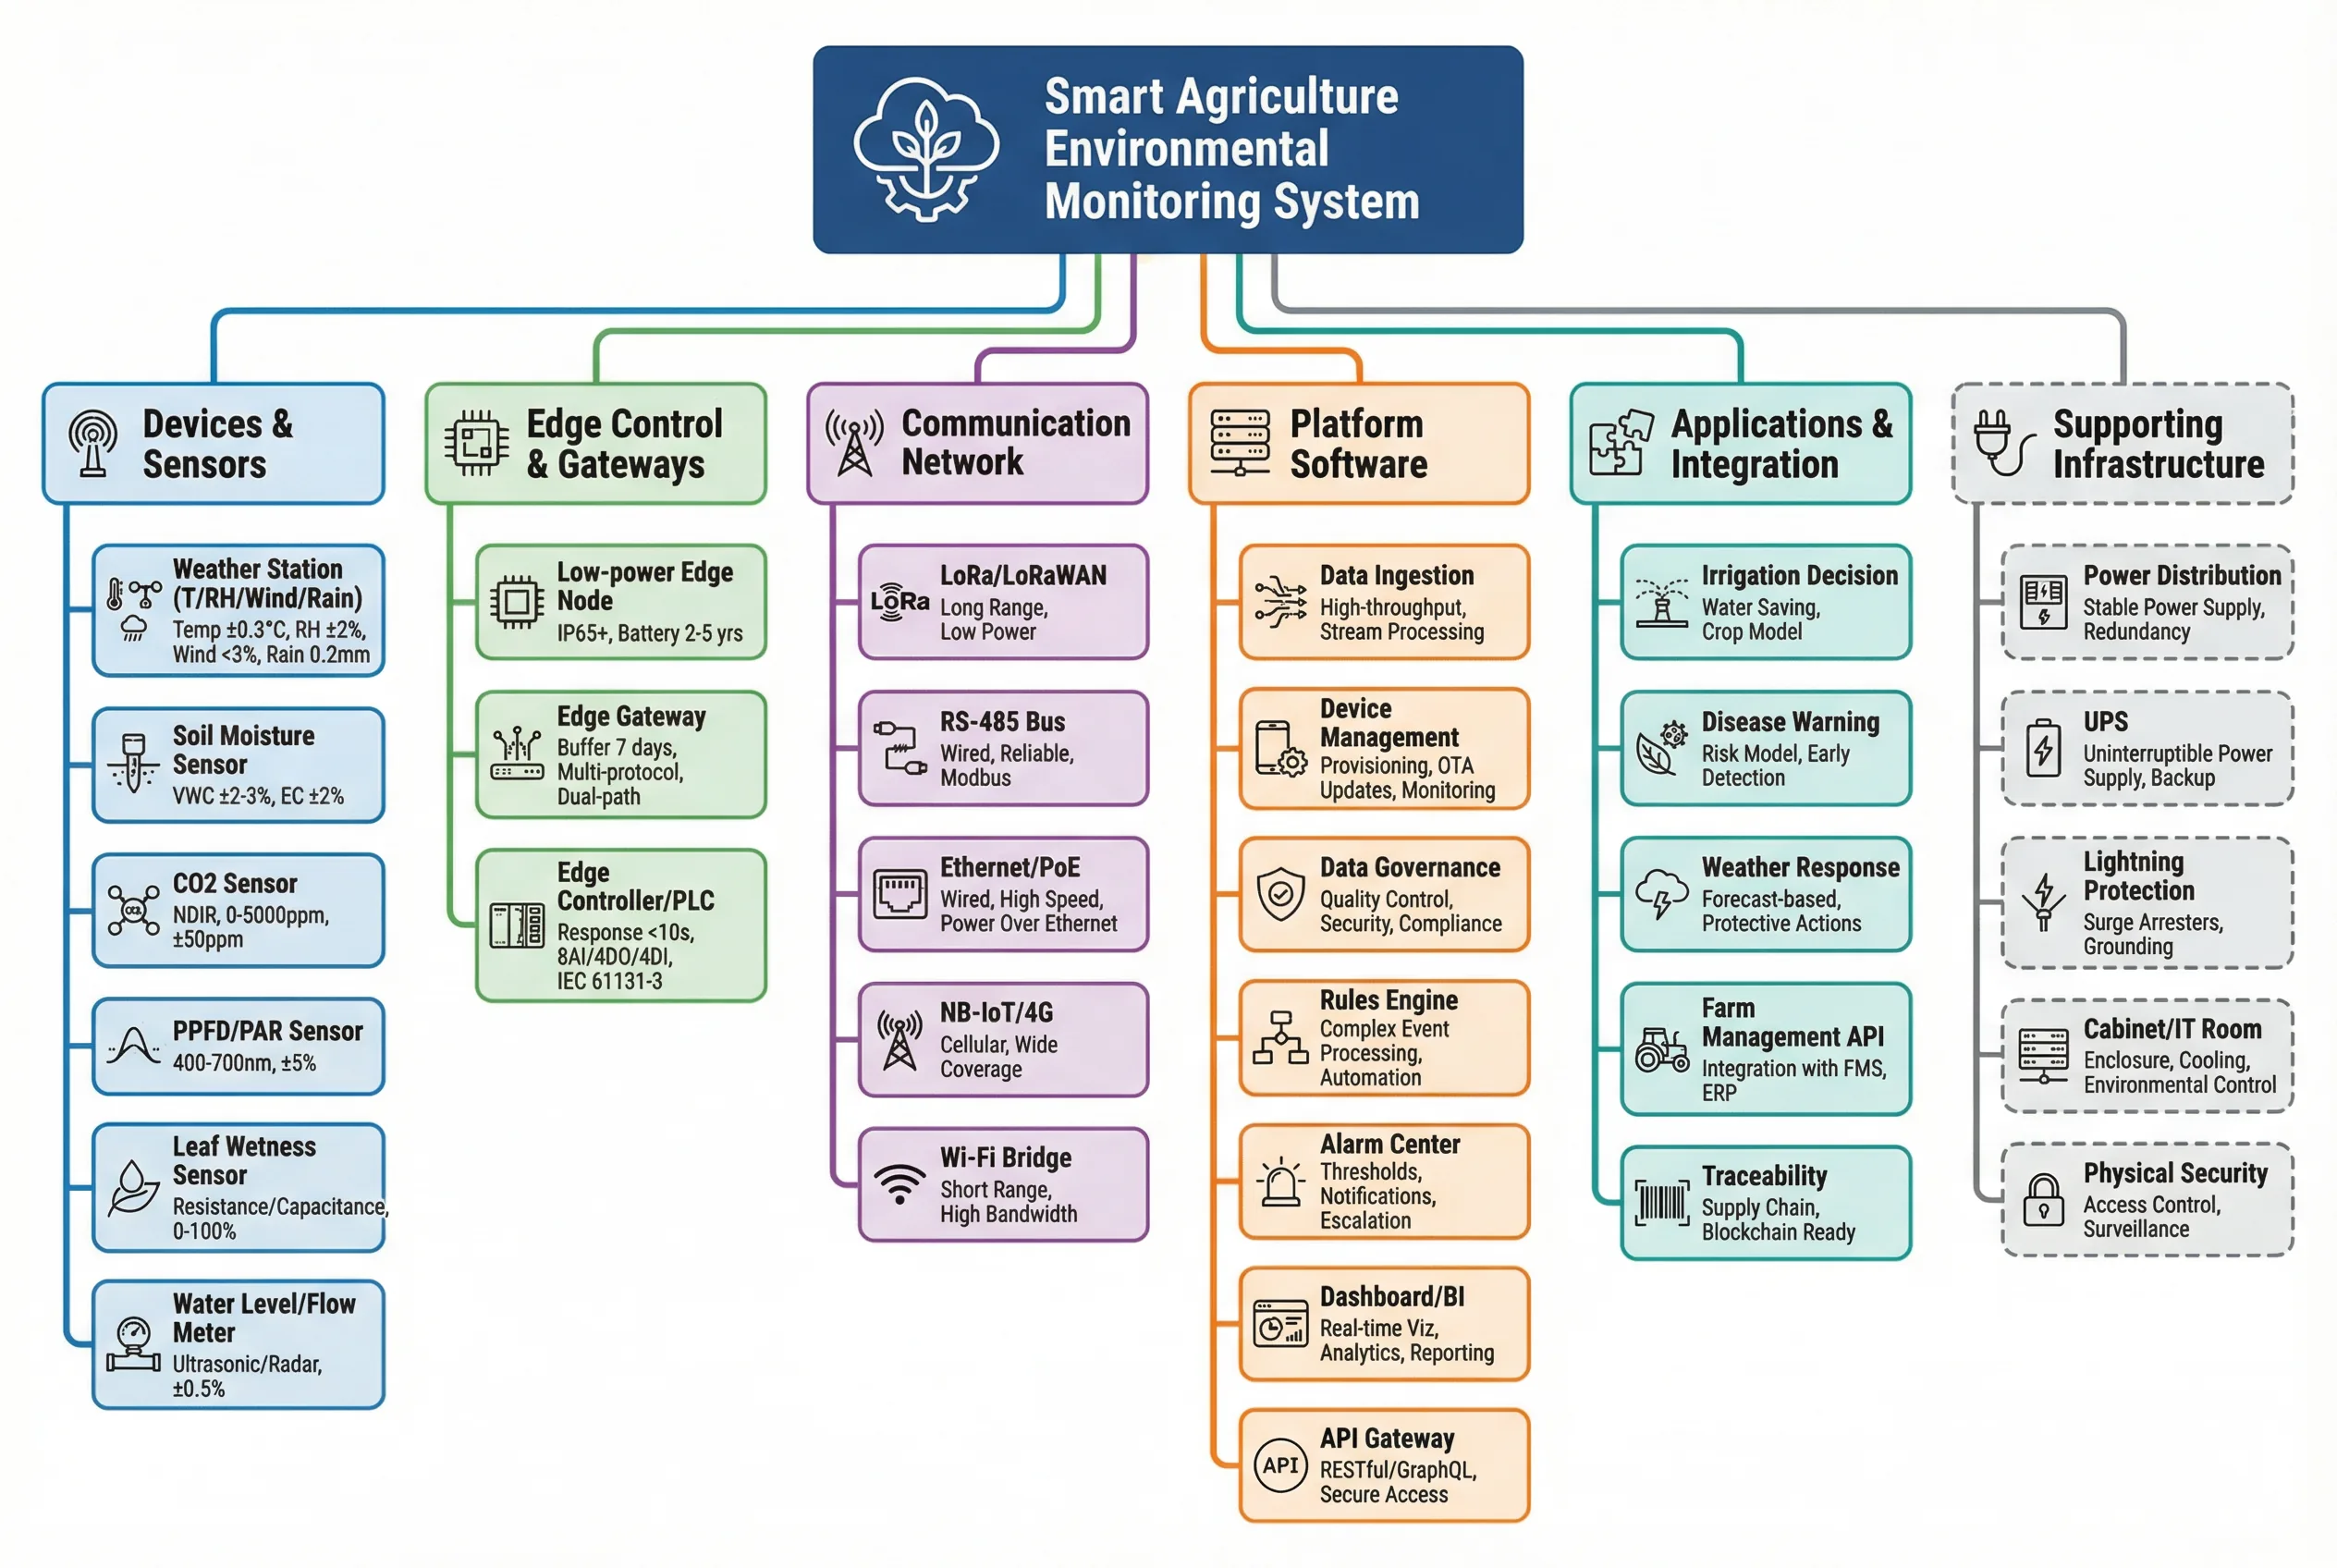
Figure 1.2: System Components Hierarchical Tree — All Components with Typical Quantities and Key KPIs
| Component | Responsibility | Key KPIs (Engineering) | Typical Mismatch Risk |
|---|---|---|---|
| Weather Station (T/RH/Wind/Rain/Pressure) | On-site microclimate baseline measurement | Temp ±0.3°C; RH ±2%RH; Wind ±0.3 m/s; Rain ±3% | Wrong siting causes biased wind/rain; poor grounding causes surge damage |
| Soil Moisture Sensor (VWC) | Irrigation decision input; root zone monitoring | VWC ±2–3% (after calibration); soil-type dependent | Air gaps during installation → unstable readings; wrong depth → non-representative |
| CO₂ Sensor | Greenhouse control; photosynthesis optimization | ±(50 ppm + 3%); NDIR preferred | Condensation damage; wrong placement near vents or doors |
| PPFD/PAR Sensor | Light management; DLI calculation | ±5%; cosine-corrected dome | Shading or angle error; dirty dome causes under-reading |
| Leaf Wetness Sensor | Disease risk model input | Repeatability ±5%; mounting orientation critical | Wrong mounting angle → false wetness readings |
| Water Level/Flow Meter | Irrigation verification; tank management | Flow ±1–2%; ultrasonic or electromagnetic | Air in pipe; insufficient straight-run upstream |
| Edge Node (Low Power) | Sampling, buffering, local QC | Uptime ≥99%; sleep current <100 µA | Battery undersized; enclosure IP insufficient for environment |
| Edge Gateway | Protocol translation, backhaul, store-and-forward | Backlog ≥7 days; dual uplink support | Cellular instability; no antenna lightning protection |
| Edge Controller (PLC/RTU) | Closed-loop control; safe fallback | Response <3–10 s; fail-safe mode | No interlock → unsafe actuator actions on sensor loss |
| Platform Ingestion | Accepts and normalizes telemetry | Loss <0.1%; idempotency; schema validation | Duplicate processing; schema drift causes silent data corruption |
| Data Governance Engine | QC flags, cleansing, calibration tracking | Flag accuracy; auditability; traceability | "Silent corruption" if not implemented — data looks fine but decisions are wrong |
| Alarm Engine | Actionable alarms with dedup and escalation | Dedup rate; escalation success; MTTA <10 min critical | Alarm fatigue from poor rules → critical alarms ignored |
| Dashboard/BI | Visibility for operators and managers | Role-based views; data freshness ≤2× interval | Wrong aggregation or stale data leads to wrong decisions |
| API Gateway | Integration with external systems | Auth, rate limiting, SLA ≥99.5% | Insecure exposure; no rate limiting → DoS risk |
1.3 Working Principles
Startup Sequence
When the system powers on, sensors and edge nodes perform self-tests including battery voltage check, sensor presence detection, and memory integrity verification. The gateway provides time synchronization via NTP if online, or uses last-known time with drift correction if offline. Each device pulls its configuration — sampling interval, alarm thresholds, and calibration coefficients — from the platform or local cache. The first data burst after power-on is marked as "warm-up" for sensors requiring stabilization, such as electrochemical gas sensors which typically need 5–30 minutes to reach stable readings.
Normal Operation Cycle
During normal operation, sensors sample at configured intervals. Edge nodes apply fast range checks and rate-of-change (ROC) checks, tag each measurement with a QC flag (valid/suspect/invalid/missing), buffer the data with sequence numbers, and transmit to the gateway. The platform performs deeper QC using historical context and cross-sensor comparisons, stores the time series with QC tags, evaluates alarm rules, writes work orders for triggered alarms, and sends recommendations to operators. Control commands flow from the platform to the edge controller, which applies safety constraints before executing actuator outputs.
Exception Handling & Recovery
Offline Mode: When backhaul is lost, the edge gateway switches to store-and-forward mode, buffering data locally. Edge controllers use last-safe setpoints and local constraint logic to maintain safe operation without cloud connectivity. Upon backhaul recovery, the gateway replays buffered data with sequence numbers; the platform de-duplicates using idempotency keys.
Exception Chains (Failure → System Behavior)
| Failure Scenario | Failure Mechanism | System Behavior | Recovery Path |
|---|---|---|---|
| Sensor Drift Chain (Soil EC) | Probe fouling/salt deposition → EC reading drifts upward → fertigation reduced incorrectly → crop stress | Platform drift detector flags "suspect"; triggers maintenance ticket; fertigation logic switches to conservative mode requiring manual confirmation | Dispatch calibration task; recalibrate or replace probe; backfill corrected data with versioning |
| Communication Outage Chain (Cellular) | Tower outage → no uplink → dashboards blank → operator overreacts | Edge continues local logging and critical control; platform shows "site offline" with last-known values; local alarms via on-site siren for extreme thresholds | Backhaul returns; gateway replays buffered data; platform de-duplicates and fills timeline gaps |
| Lightning Surge Chain (Gateway/RS-485) | Near strike induces surge on long cables → transceiver damage → multiple sensors silent | Gateway detects bus failure, isolates segment via fused RS-485 protectors, raises "segment offline" alarm | Spare gateway procedure; replace SPD if triggered; verify grounding; restore within SLA |
| Sensor Stuck-at Value | Sensor output constant for too long → QC ROC check triggers | Flag suspect; exclude from control decisions; create maintenance ticket automatically | Physical inspection; clean or replace sensor; verify readings against reference |
Critical Design Principle: Every exception chain must have a defined system behavior that maintains safety (no unsafe actuator actions) and data integrity (no silent corruption). Design the exception handling before deployment, not after the first incident.