Chapter 3: Scenarios & Selection
Eight primary application scenarios with real-site photography, key technical parameters, sensor selection guidance, and deployment notes.
3.1 Scenario Overview
Smart agriculture environmental monitoring spans a wide range of production environments, each with distinct microclimatic characteristics, crop physiology requirements, and engineering constraints. The eight scenarios covered in this chapter represent the primary deployment contexts encountered in commercial agriculture. For each scenario, the selection of sensors, communications technology, power architecture, and control strategy must be adapted to the specific environmental envelope, crop sensitivity, and operational capacity of the farm.
The table below provides a high-level comparison of the eight scenarios across the key engineering dimensions that drive design decisions. Use this matrix as a starting point for scenario-specific design, then refer to the detailed scenario profiles below for implementation guidance.
| Scenario | Primary Crops/Use | Key Sensors | Comm. Technology | Power Model | Control Complexity |
|---|---|---|---|---|---|
| Greenhouse Horticulture | Tomato, pepper, cucumber, lettuce | T/RH, CO₂, PPFD, leaf wetness, soil VWC/EC | RS-485 / Ethernet | Grid + UPS | High (closed-loop) |
| Open-Field Crop | Wheat, corn, soybean, cotton | Weather station, soil VWC (multi-depth), rain gauge | LoRa / NB-IoT | Solar + battery | Low–Medium |
| Orchard & Tea Garden | Apple, citrus, tea, grape | T/RH, leaf wetness, soil VWC, frost sensor | LoRa / 4G | Solar + battery | Medium (frost alert) |
| Pasture & Livestock | Cattle, sheep, dairy | Weather station, ambient T/RH, solar radiation | LoRa / cellular | Solar + battery | Low |
| Aquaculture Pond | Fish, shrimp, crab | DO, pH, water T, turbidity, water level, NH₃ | LoRa / Ethernet | Grid / solar | High (aeration control) |
| Tea Garden (Mountain) | Green tea, oolong, pu-erh | T/RH, leaf wetness, soil moisture, fog sensor | LoRa / 4G | Solar + battery | Medium |
| Vertical Farm / Indoor | Leafy greens, herbs, microgreens | T/RH, CO₂, PPFD, EC, pH (hydroponic) | Ethernet / Wi-Fi | Grid | Very High (full automation) |
| Rice Paddy | Rice (paddy) | Water level, water T, soil T, weather station | LoRa / NB-IoT | Solar + battery | Medium (water management) |
3.2 Application Scenario Profiles
Each scenario profile below includes a real-site photograph, a detailed description of the monitoring requirements and engineering challenges, and a set of key technical indicators (KPIs) that define the acceptance criteria for that scenario. The KPIs are organized into sensor accuracy, communications performance, and control response categories.
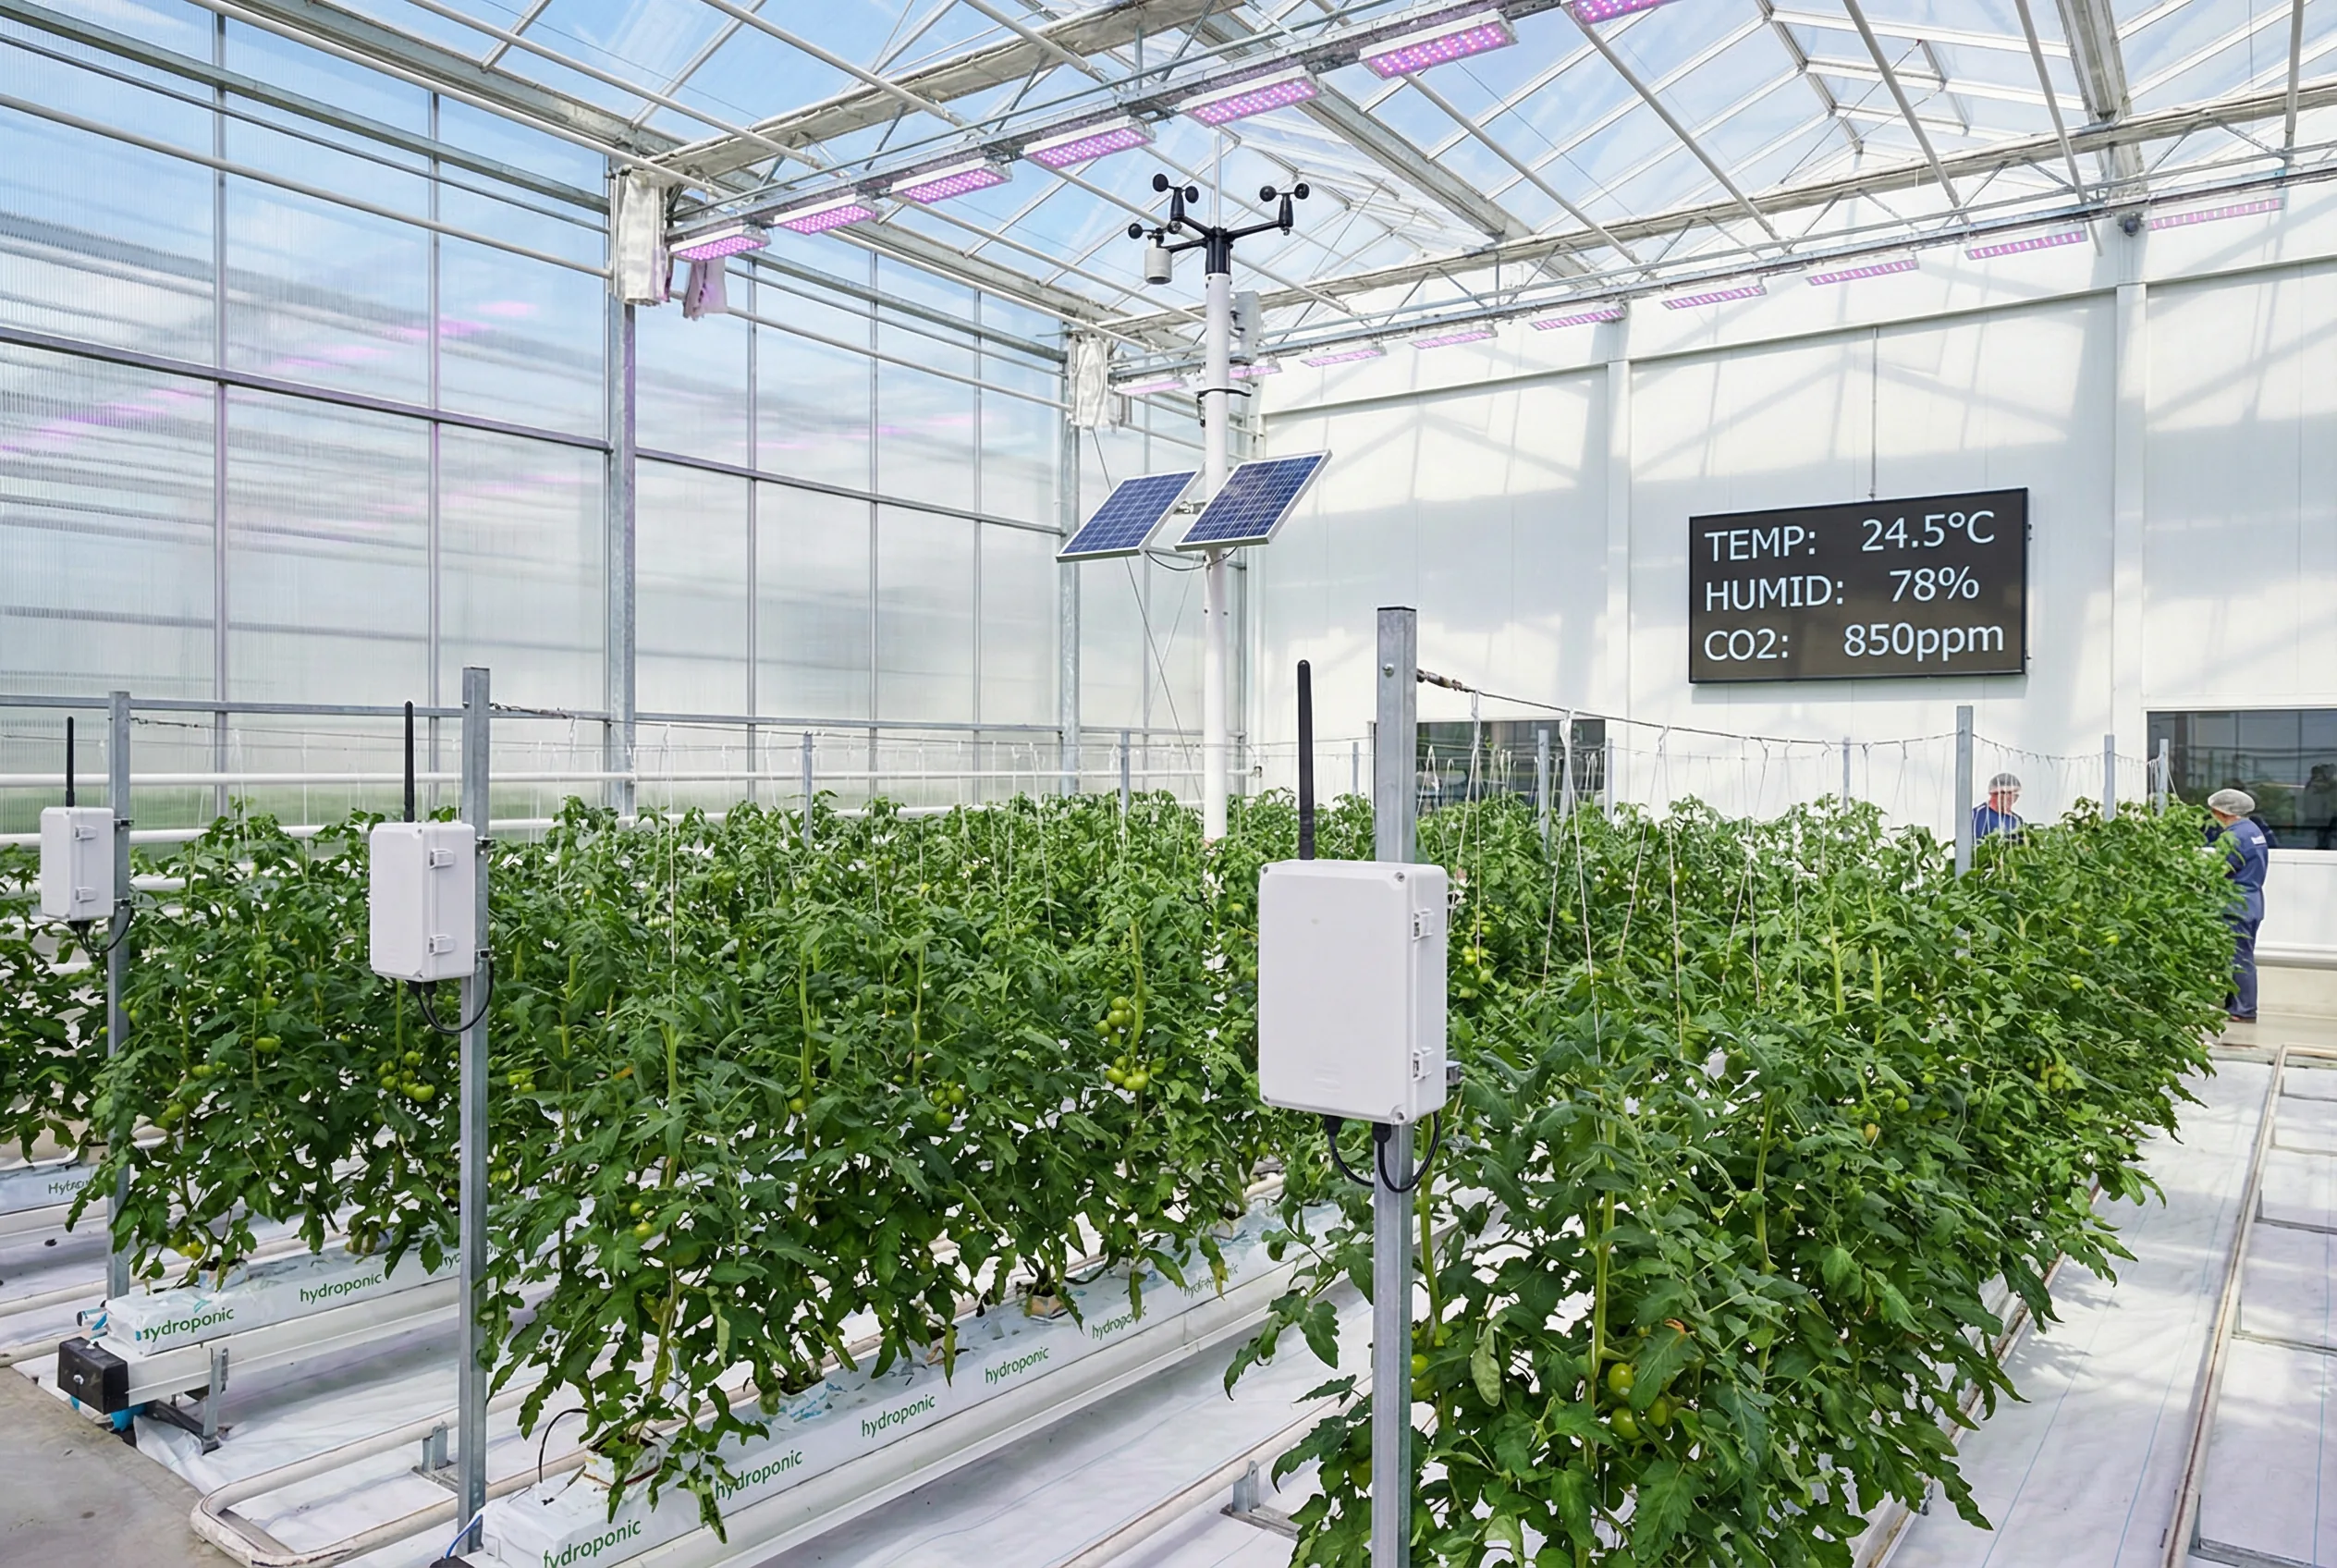
Modern commercial greenhouses require continuous monitoring of temperature, relative humidity, CO₂ concentration, light intensity (PPFD), and soil/substrate parameters to maintain optimal crop microclimate. The system must support closed-loop control of ventilation fans, shade screens, heating systems, and CO₂ supplementation. Sensor placement follows the "representative zone" principle: one monitoring point per 500–2,000 m² of growing area, with additional points at crop canopy height and near vents. RS-485 wired bus is preferred for reliability; LoRa wireless supplements for zones where cable routing is impractical. The control system must include safe fallback states for sensor loss or communication failure.
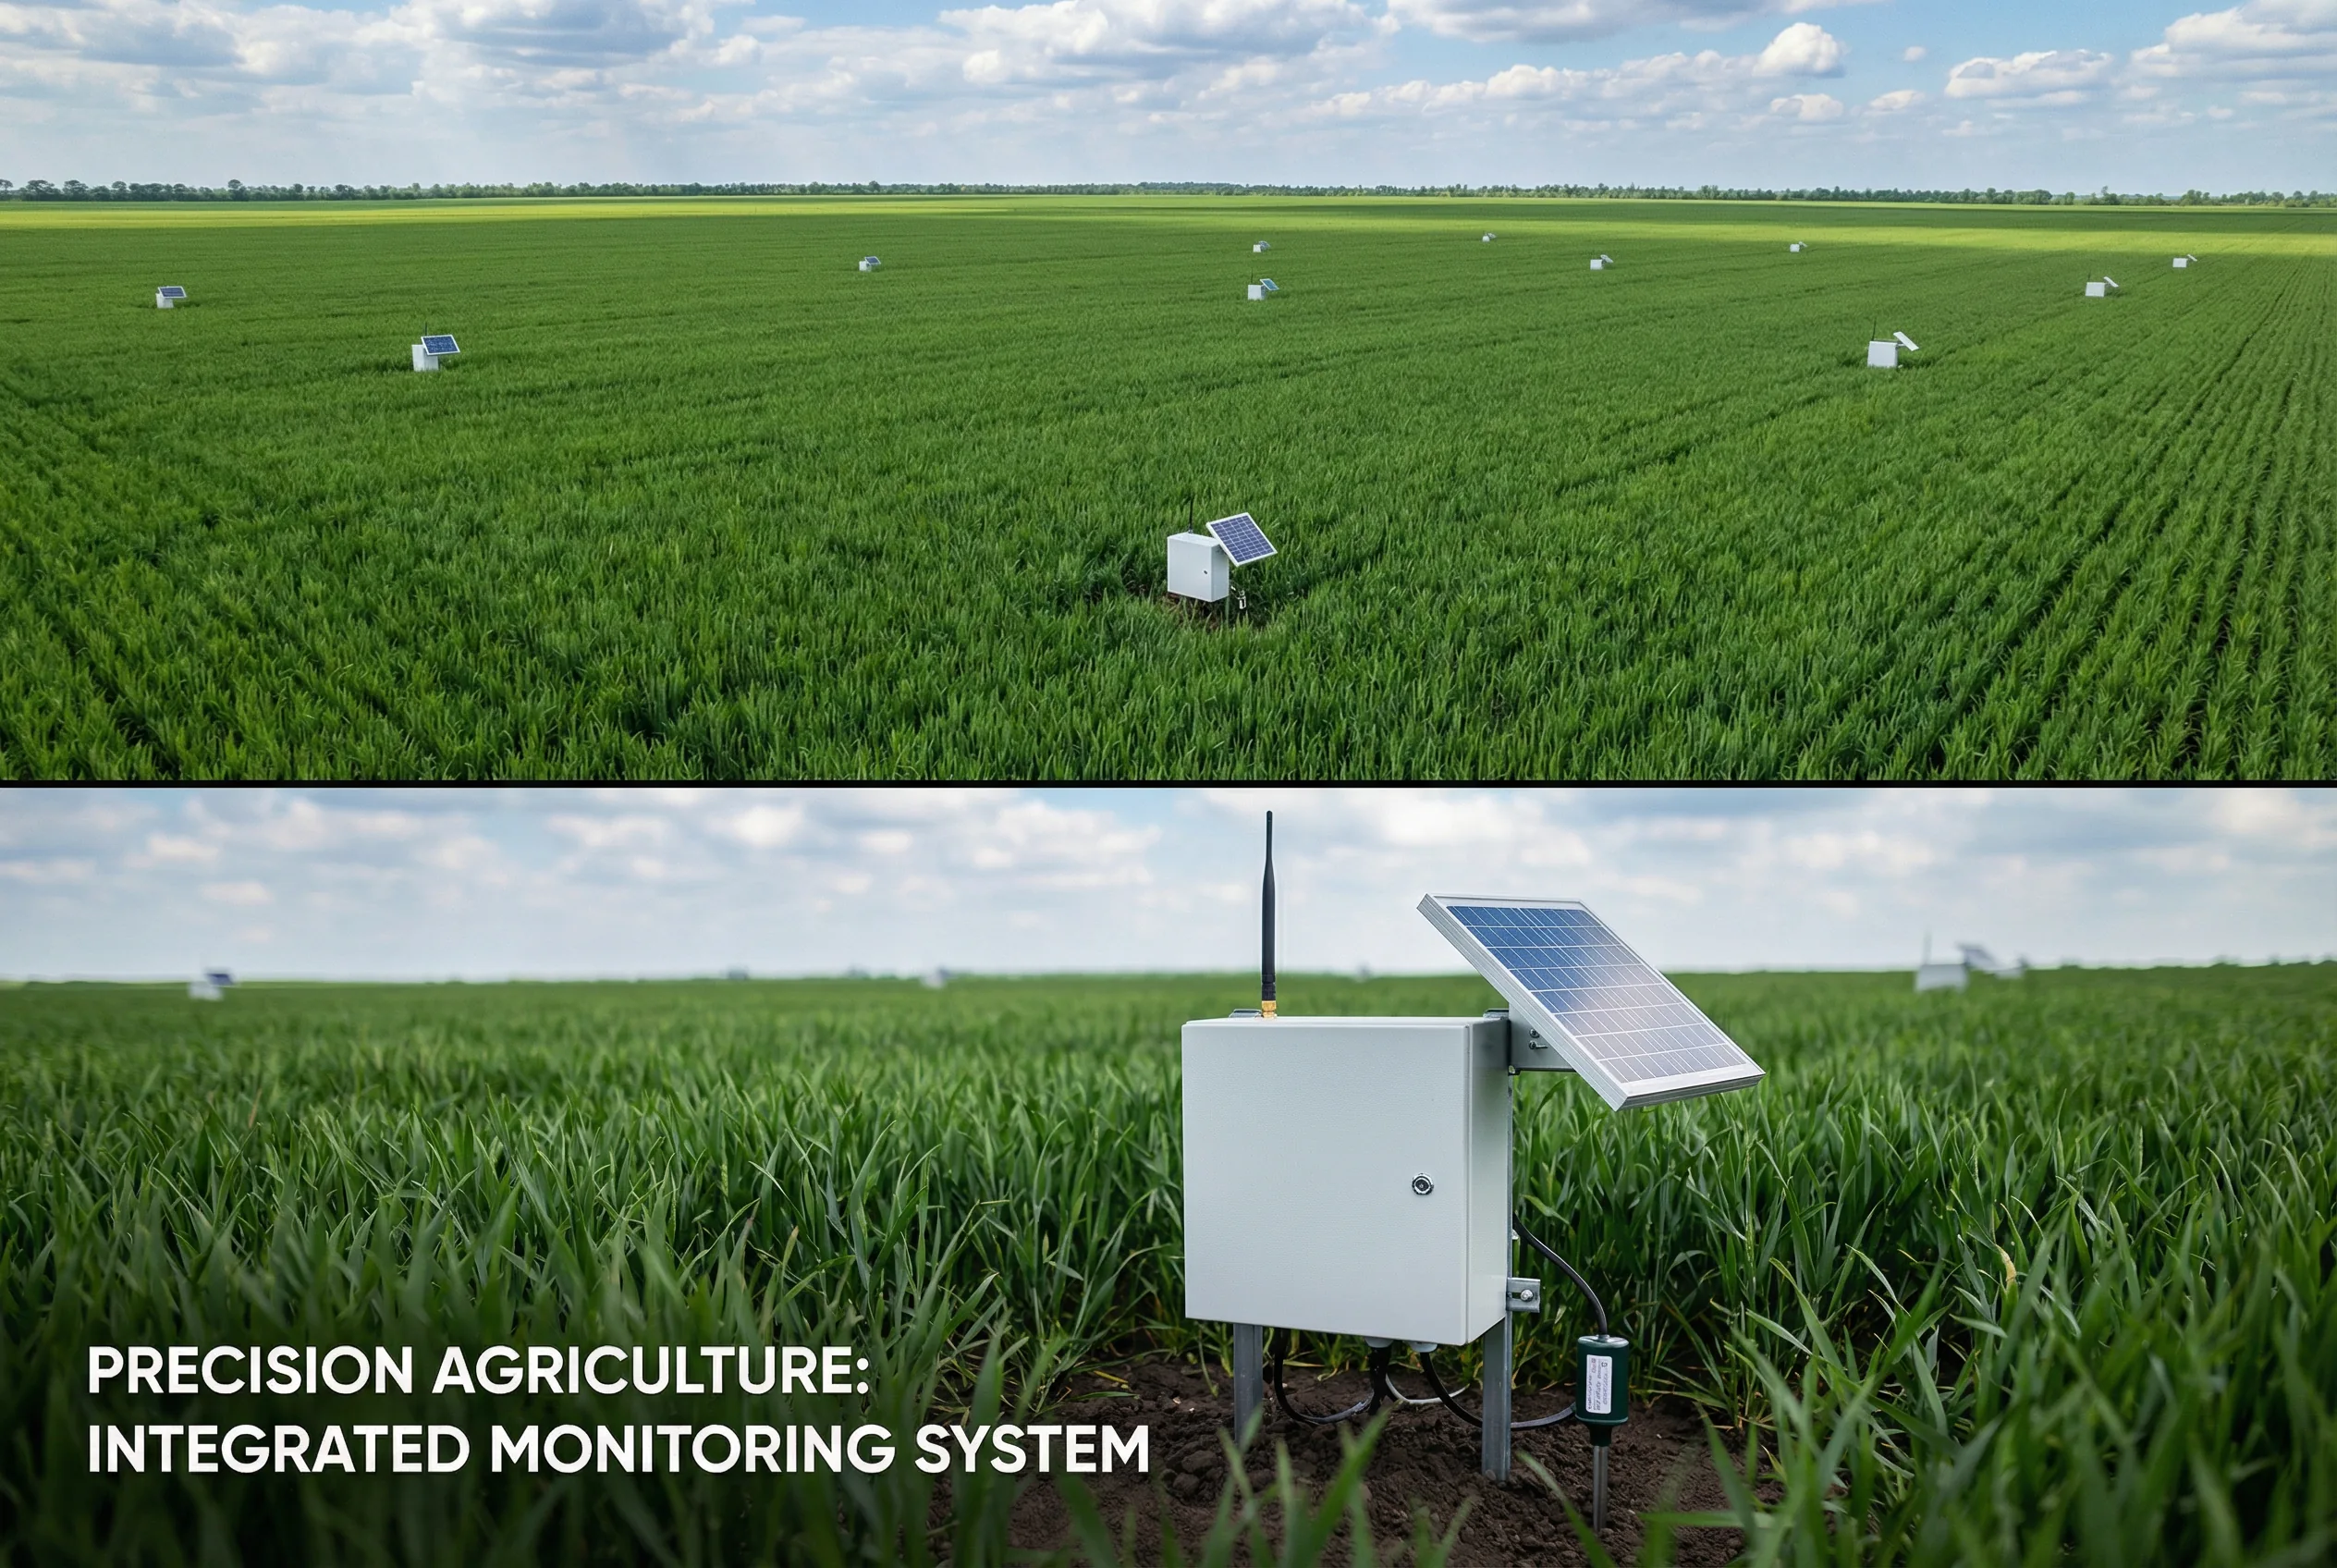
Open-field deployments cover large areas (10–10,000+ ha) with distributed monitoring points that must operate without grid power. Solar-powered LoRa or NB-IoT nodes measure soil volumetric water content (VWC) at multiple depths (typically 20 cm, 40 cm, 60 cm), soil temperature, and local microclimate. A central weather station provides reference data for ET₀ calculation. The primary use case is precision irrigation scheduling, reducing water application by 15–30% compared to calendar-based irrigation. Key challenges include RF coverage across large areas with vegetation obstruction, battery performance in winter, and soil sensor calibration per soil texture type.
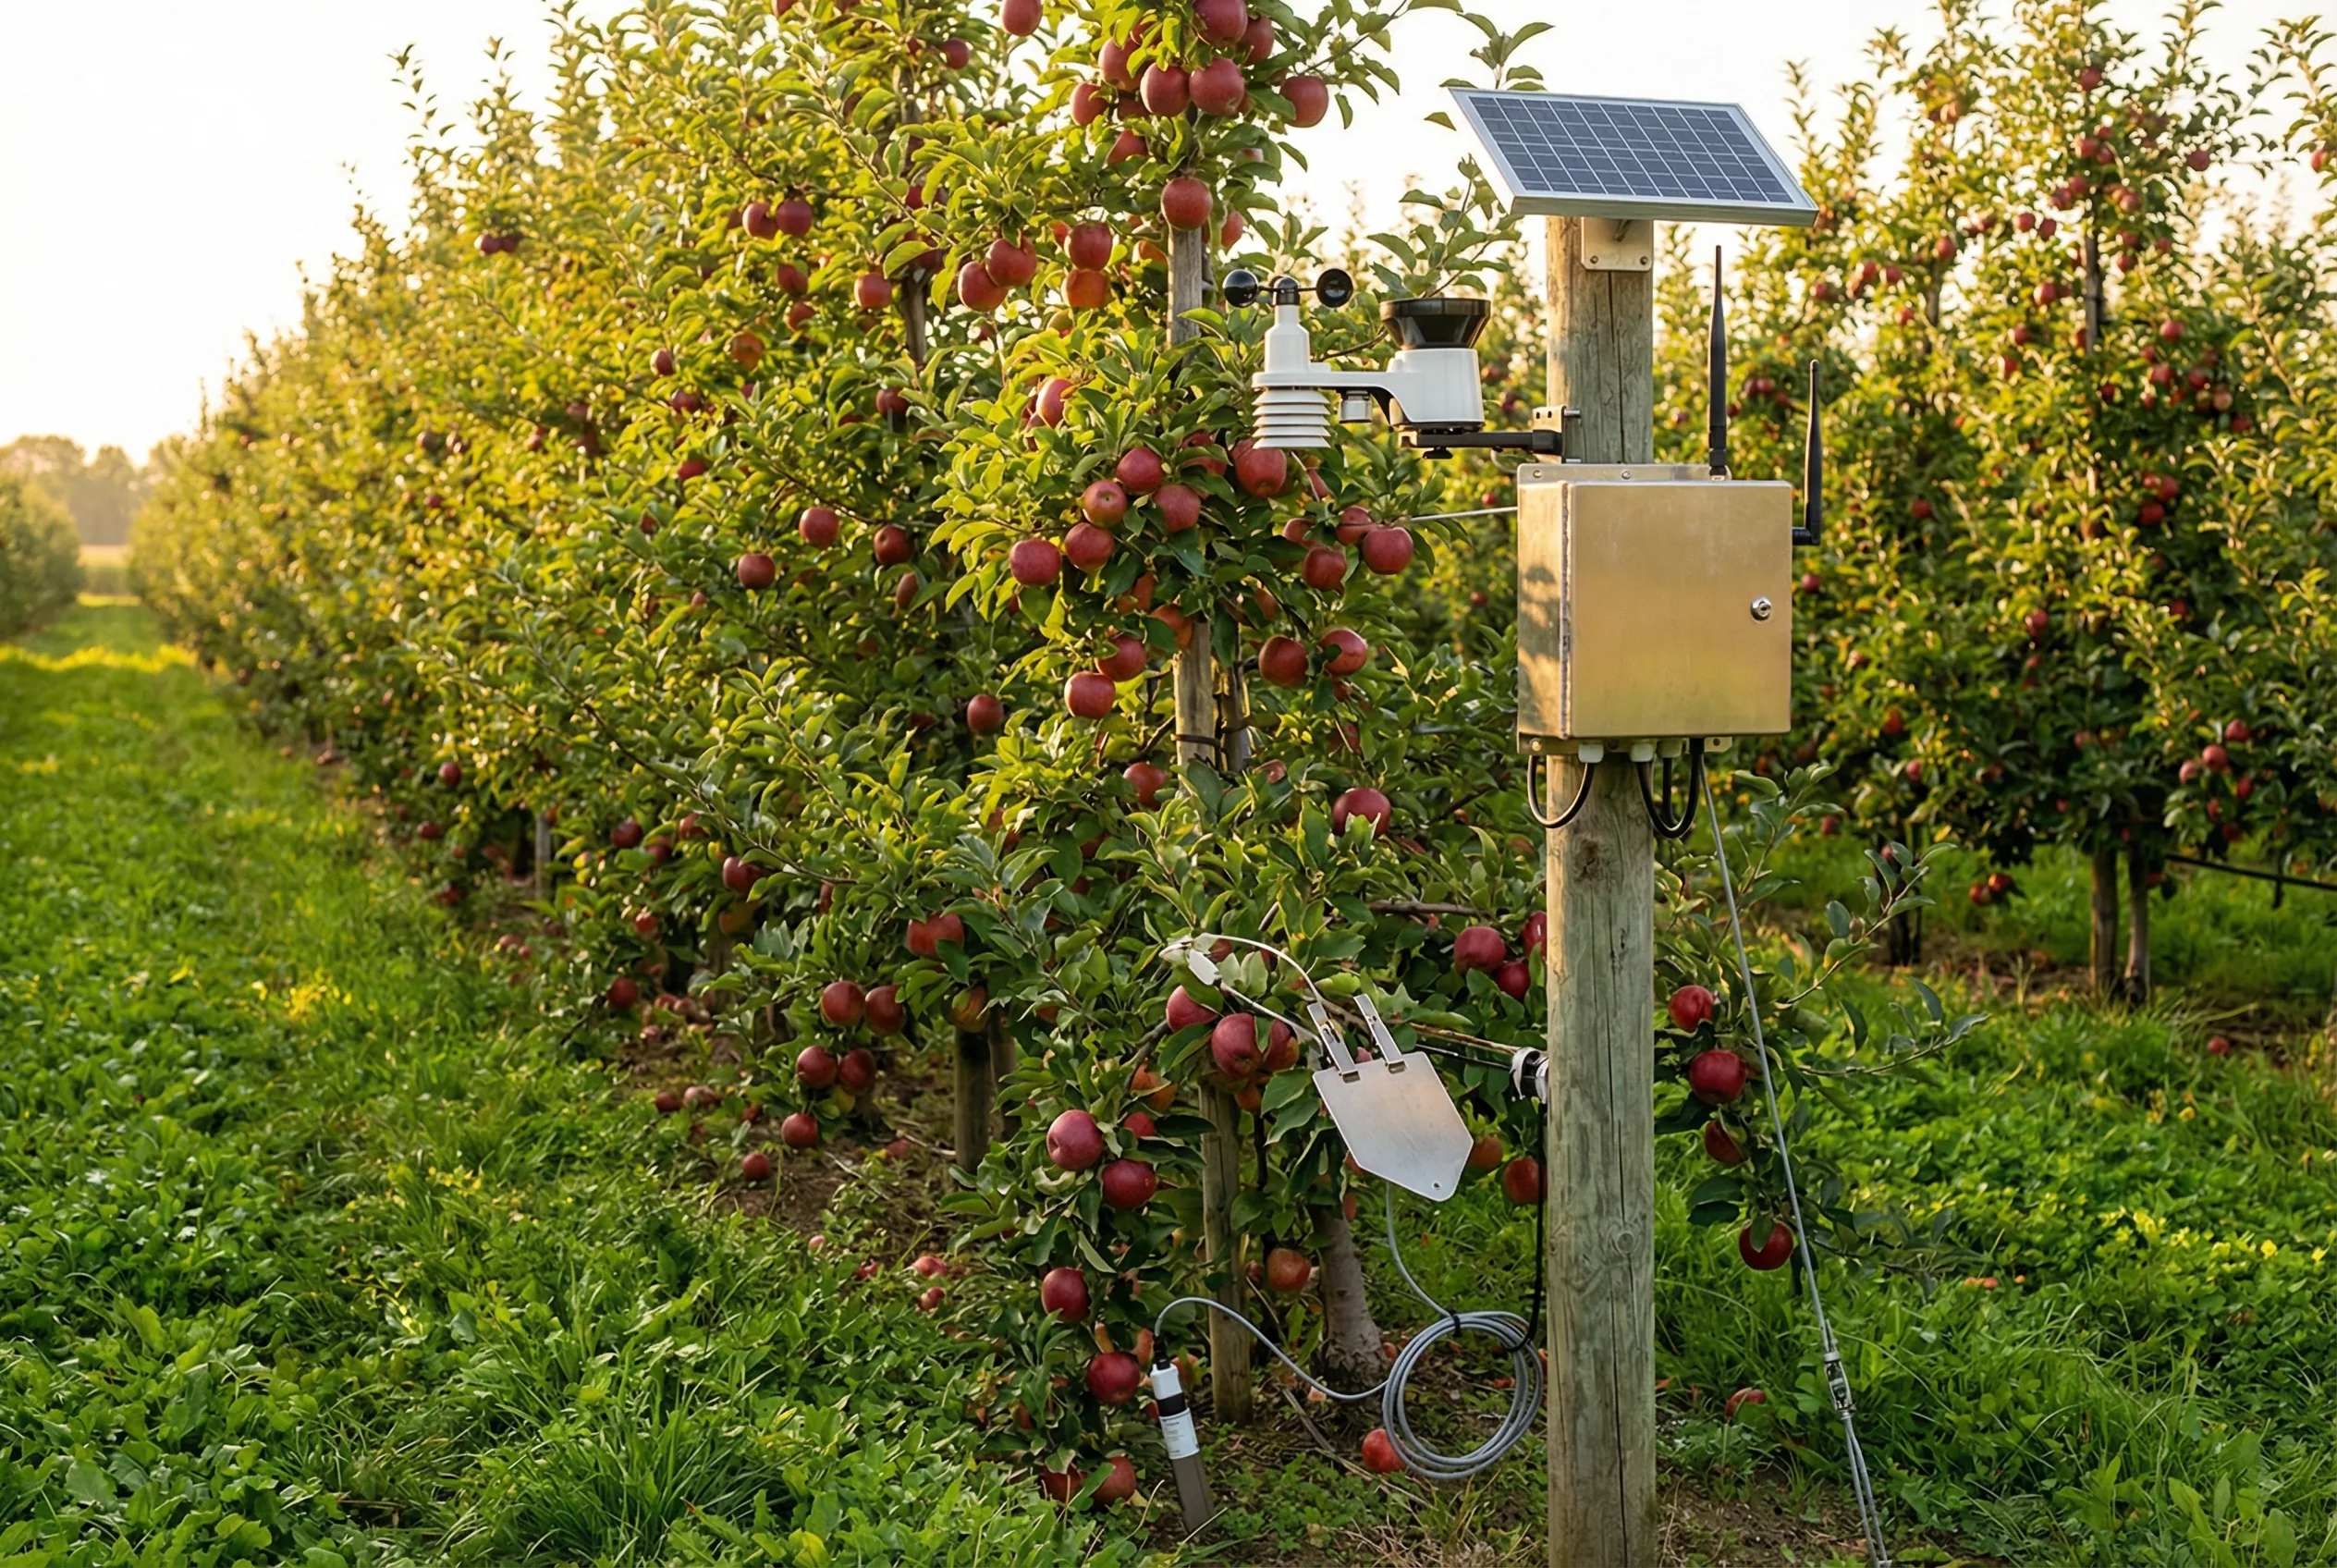
Orchards present unique monitoring challenges: canopy microclimate differs significantly from ambient conditions, frost risk during flowering is a critical crop loss event, and disease risk models (e.g., fire blight, scab, powdery mildew) require leaf wetness duration and temperature data. Monitoring stations are placed within the canopy at representative locations — typically one station per 2–5 ha. Frost alarm latency must be less than 5 minutes from threshold crossing to operator notification, allowing time to activate frost protection (wind machines, overhead irrigation, heaters). Leaf wetness sensors must be mounted at the correct angle and orientation to represent actual leaf conditions.
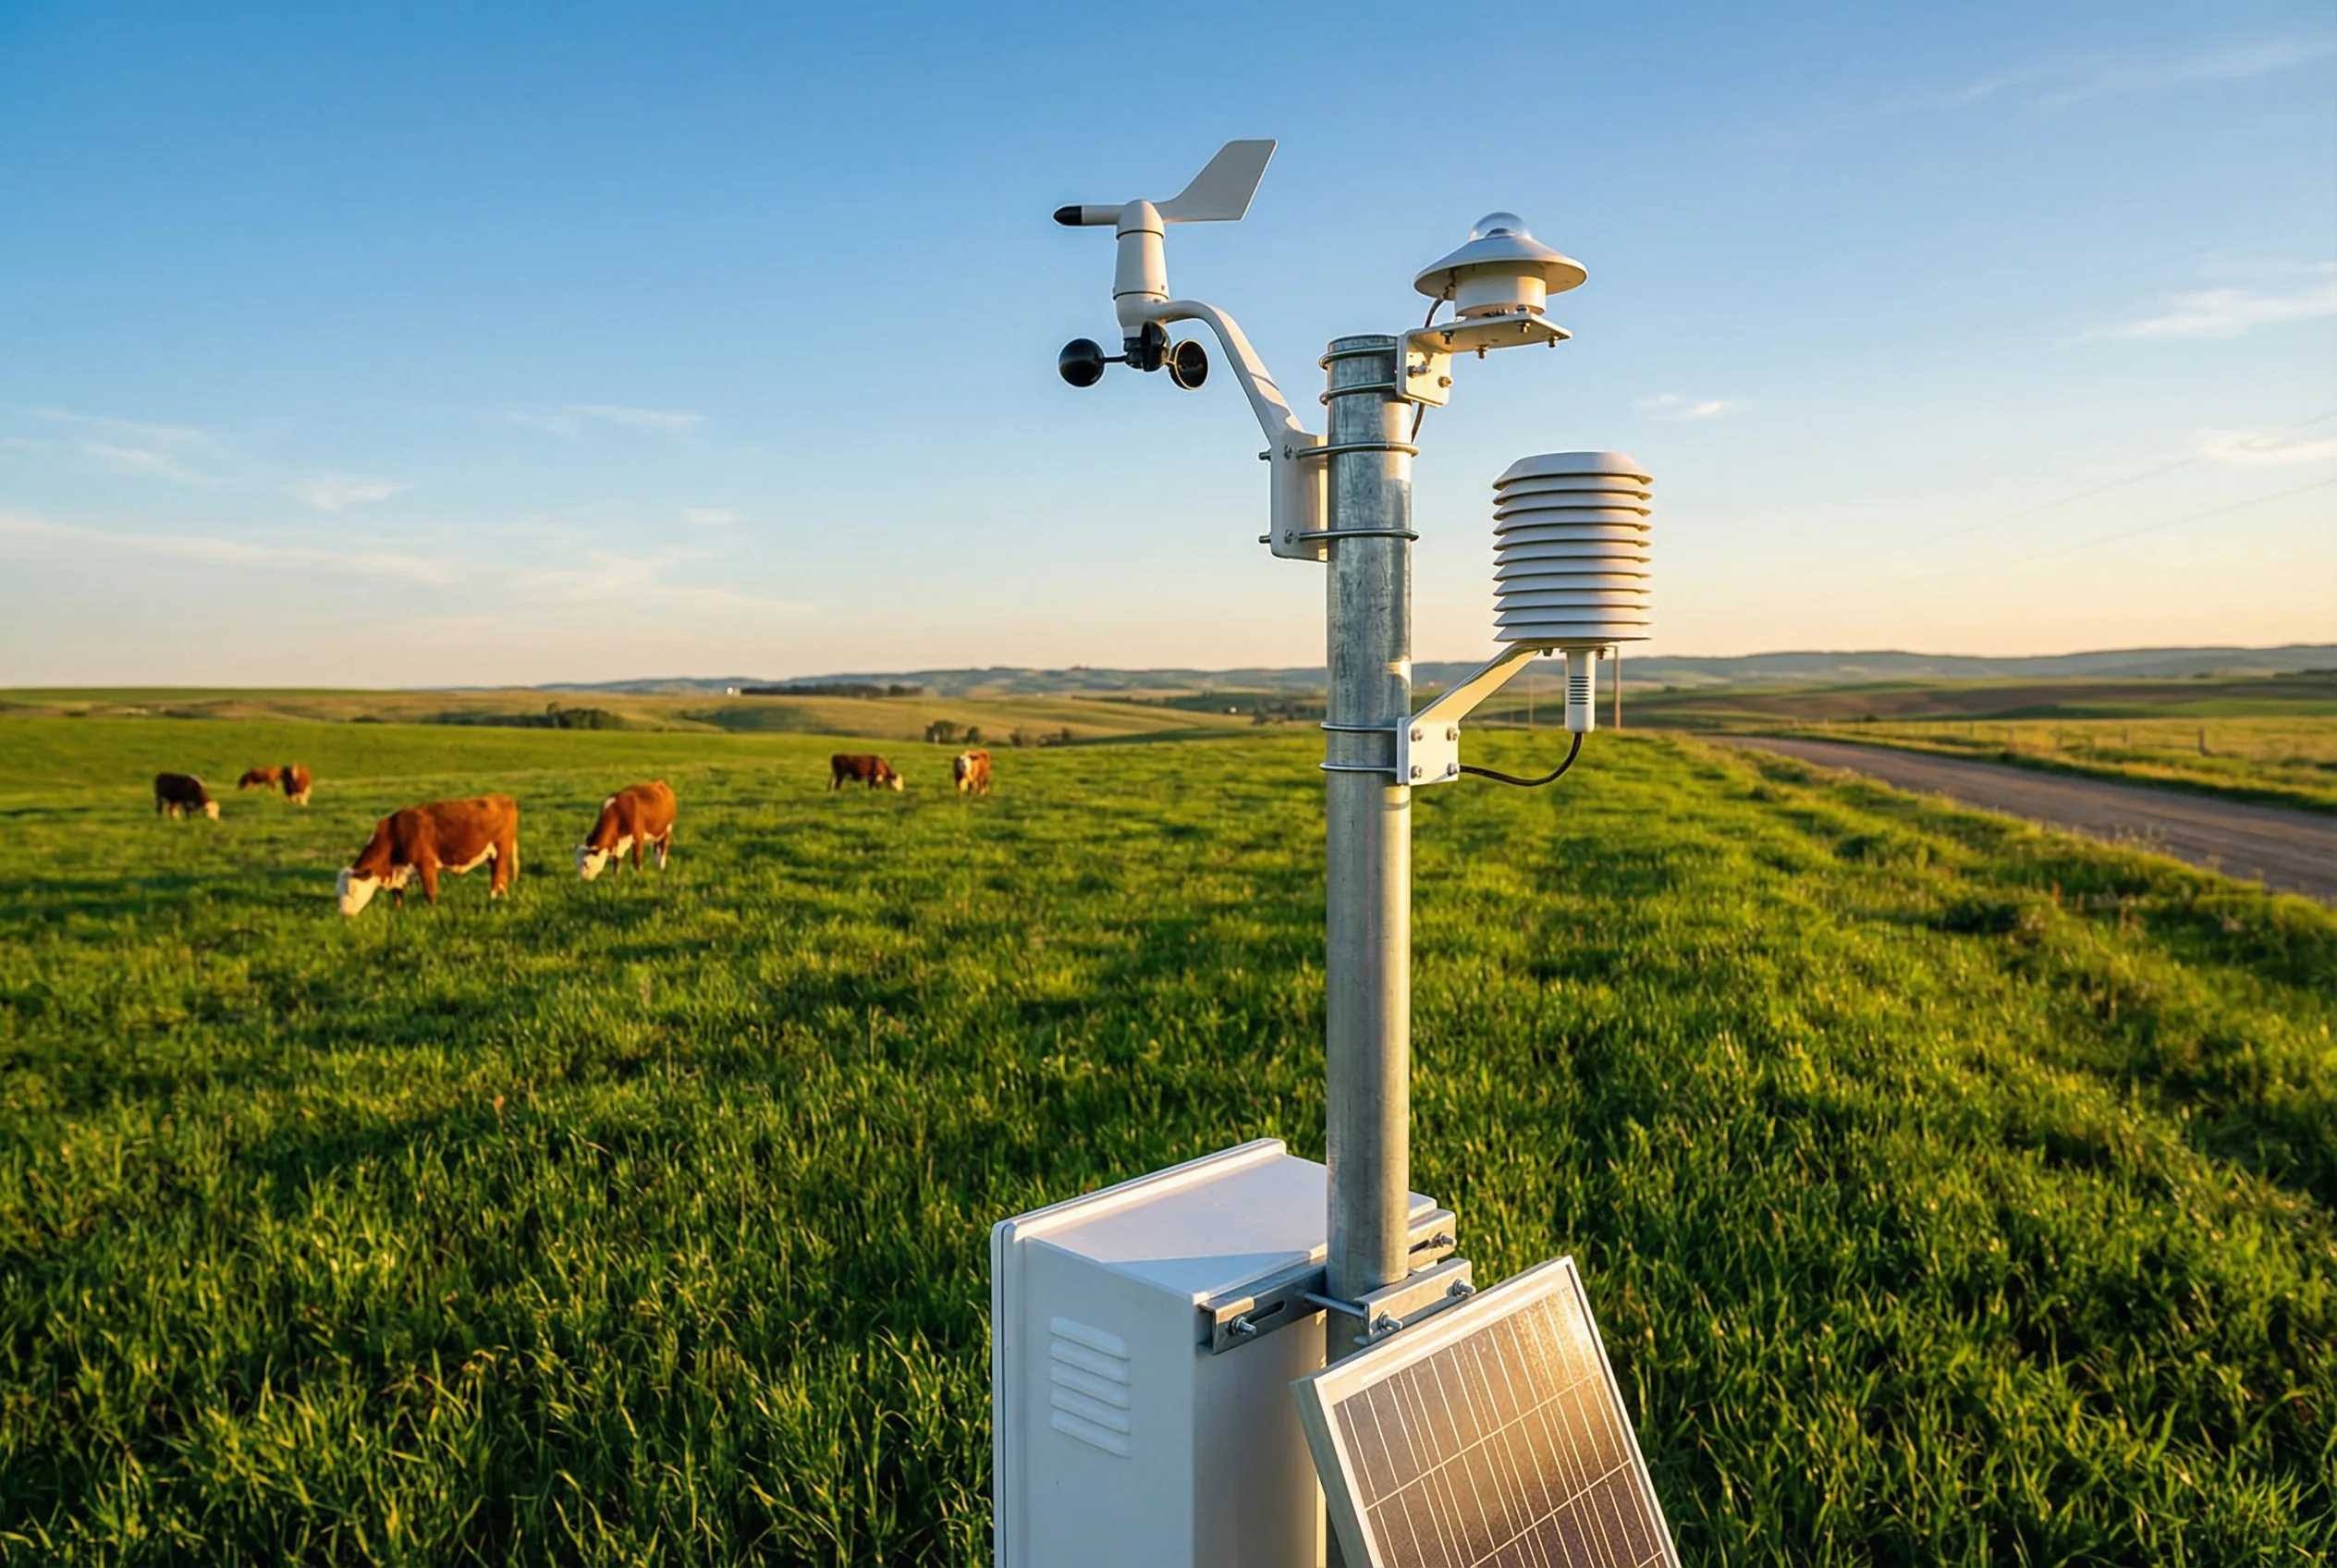
Pasture monitoring focuses on ambient weather conditions that affect livestock heat stress, pasture growth rate, and water management. The Temperature-Humidity Index (THI) is the primary derived parameter for dairy cattle heat stress assessment (THI > 72 triggers intervention). Monitoring stations are placed at representative open-field locations, typically on elevated masts to avoid obstruction. Wind speed and direction data support ventilation planning for barn environments. In extensive grazing systems, stations may be spaced 5–15 km apart, requiring cellular backhaul. Lightning protection is critical for tall mast installations in open terrain.
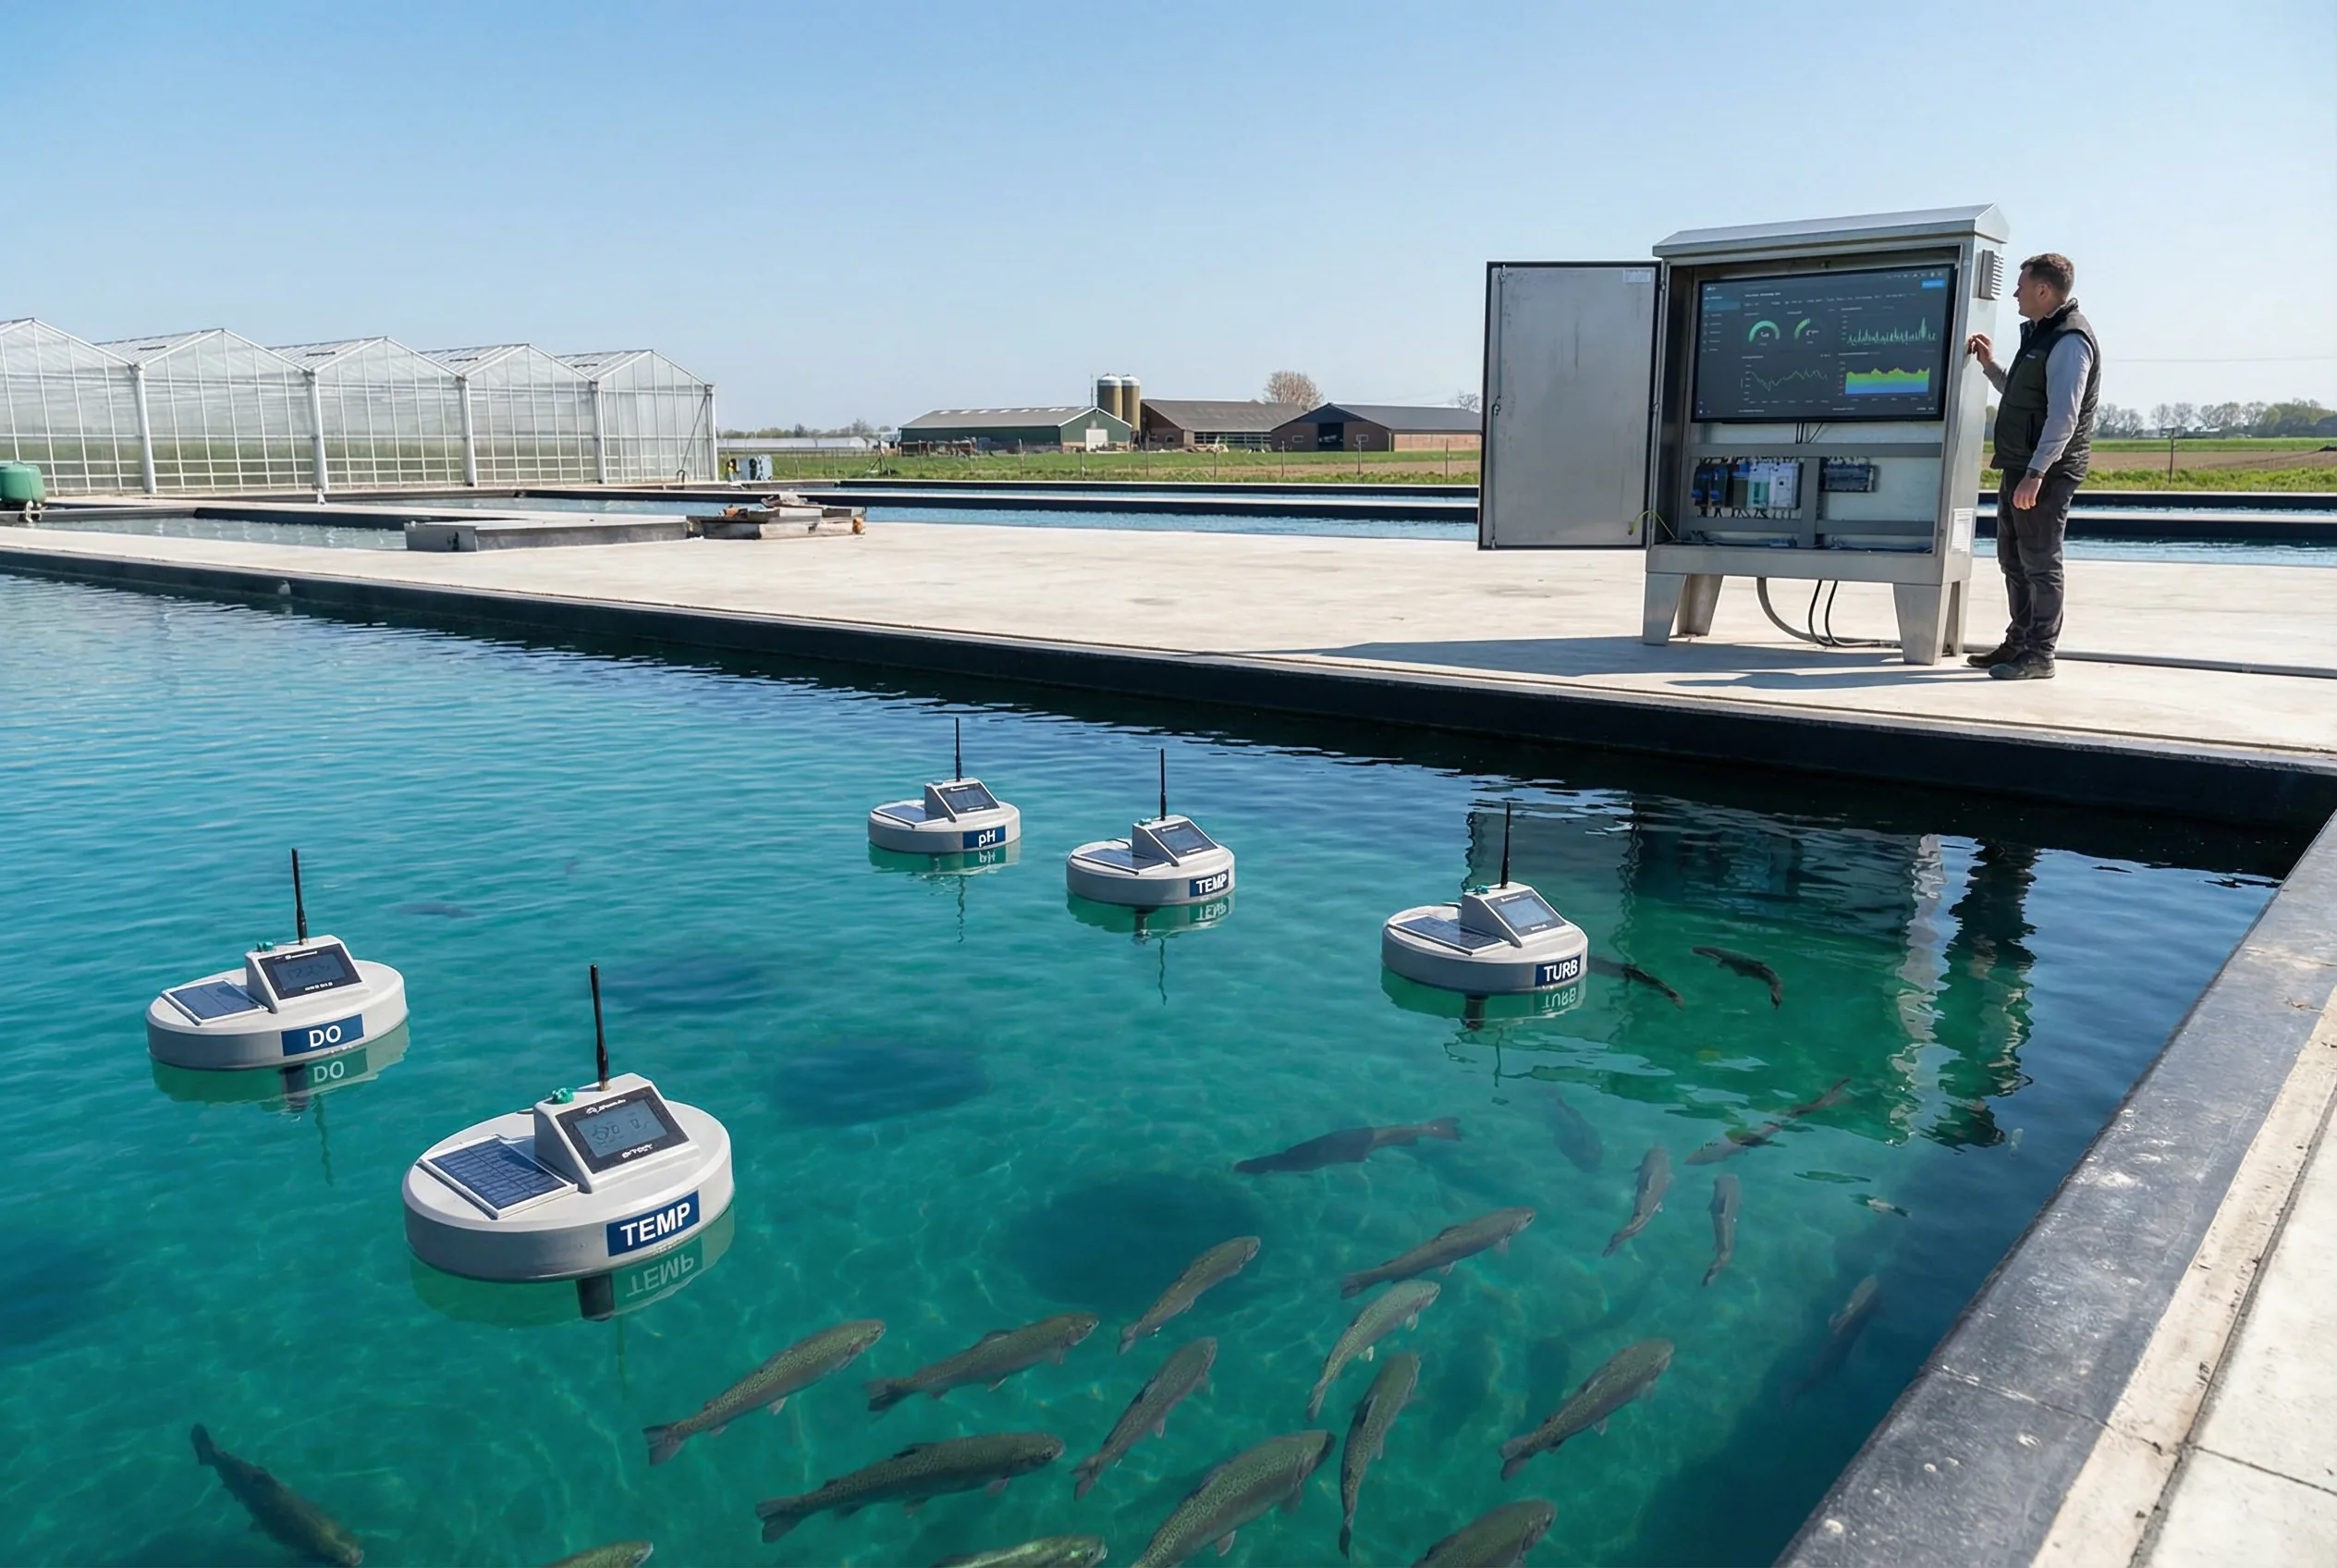
Aquaculture monitoring is among the most demanding scenarios for sensor maintenance and calibration frequency. Dissolved oxygen (DO) is the critical parameter — DO below 4 mg/L triggers emergency aeration within minutes to prevent fish mortality. pH, water temperature, turbidity, and ammonia nitrogen (NH₃-N) complete the core parameter set. Sensors must be cleaned and calibrated weekly to biweekly due to biofouling. Floating buoy-mounted sensors provide representative measurements at 20–30 cm depth. The control system links DO alarms to automatic aeration pump activation with a response time under 2 minutes. Redundant DO sensors are strongly recommended for high-value aquaculture.
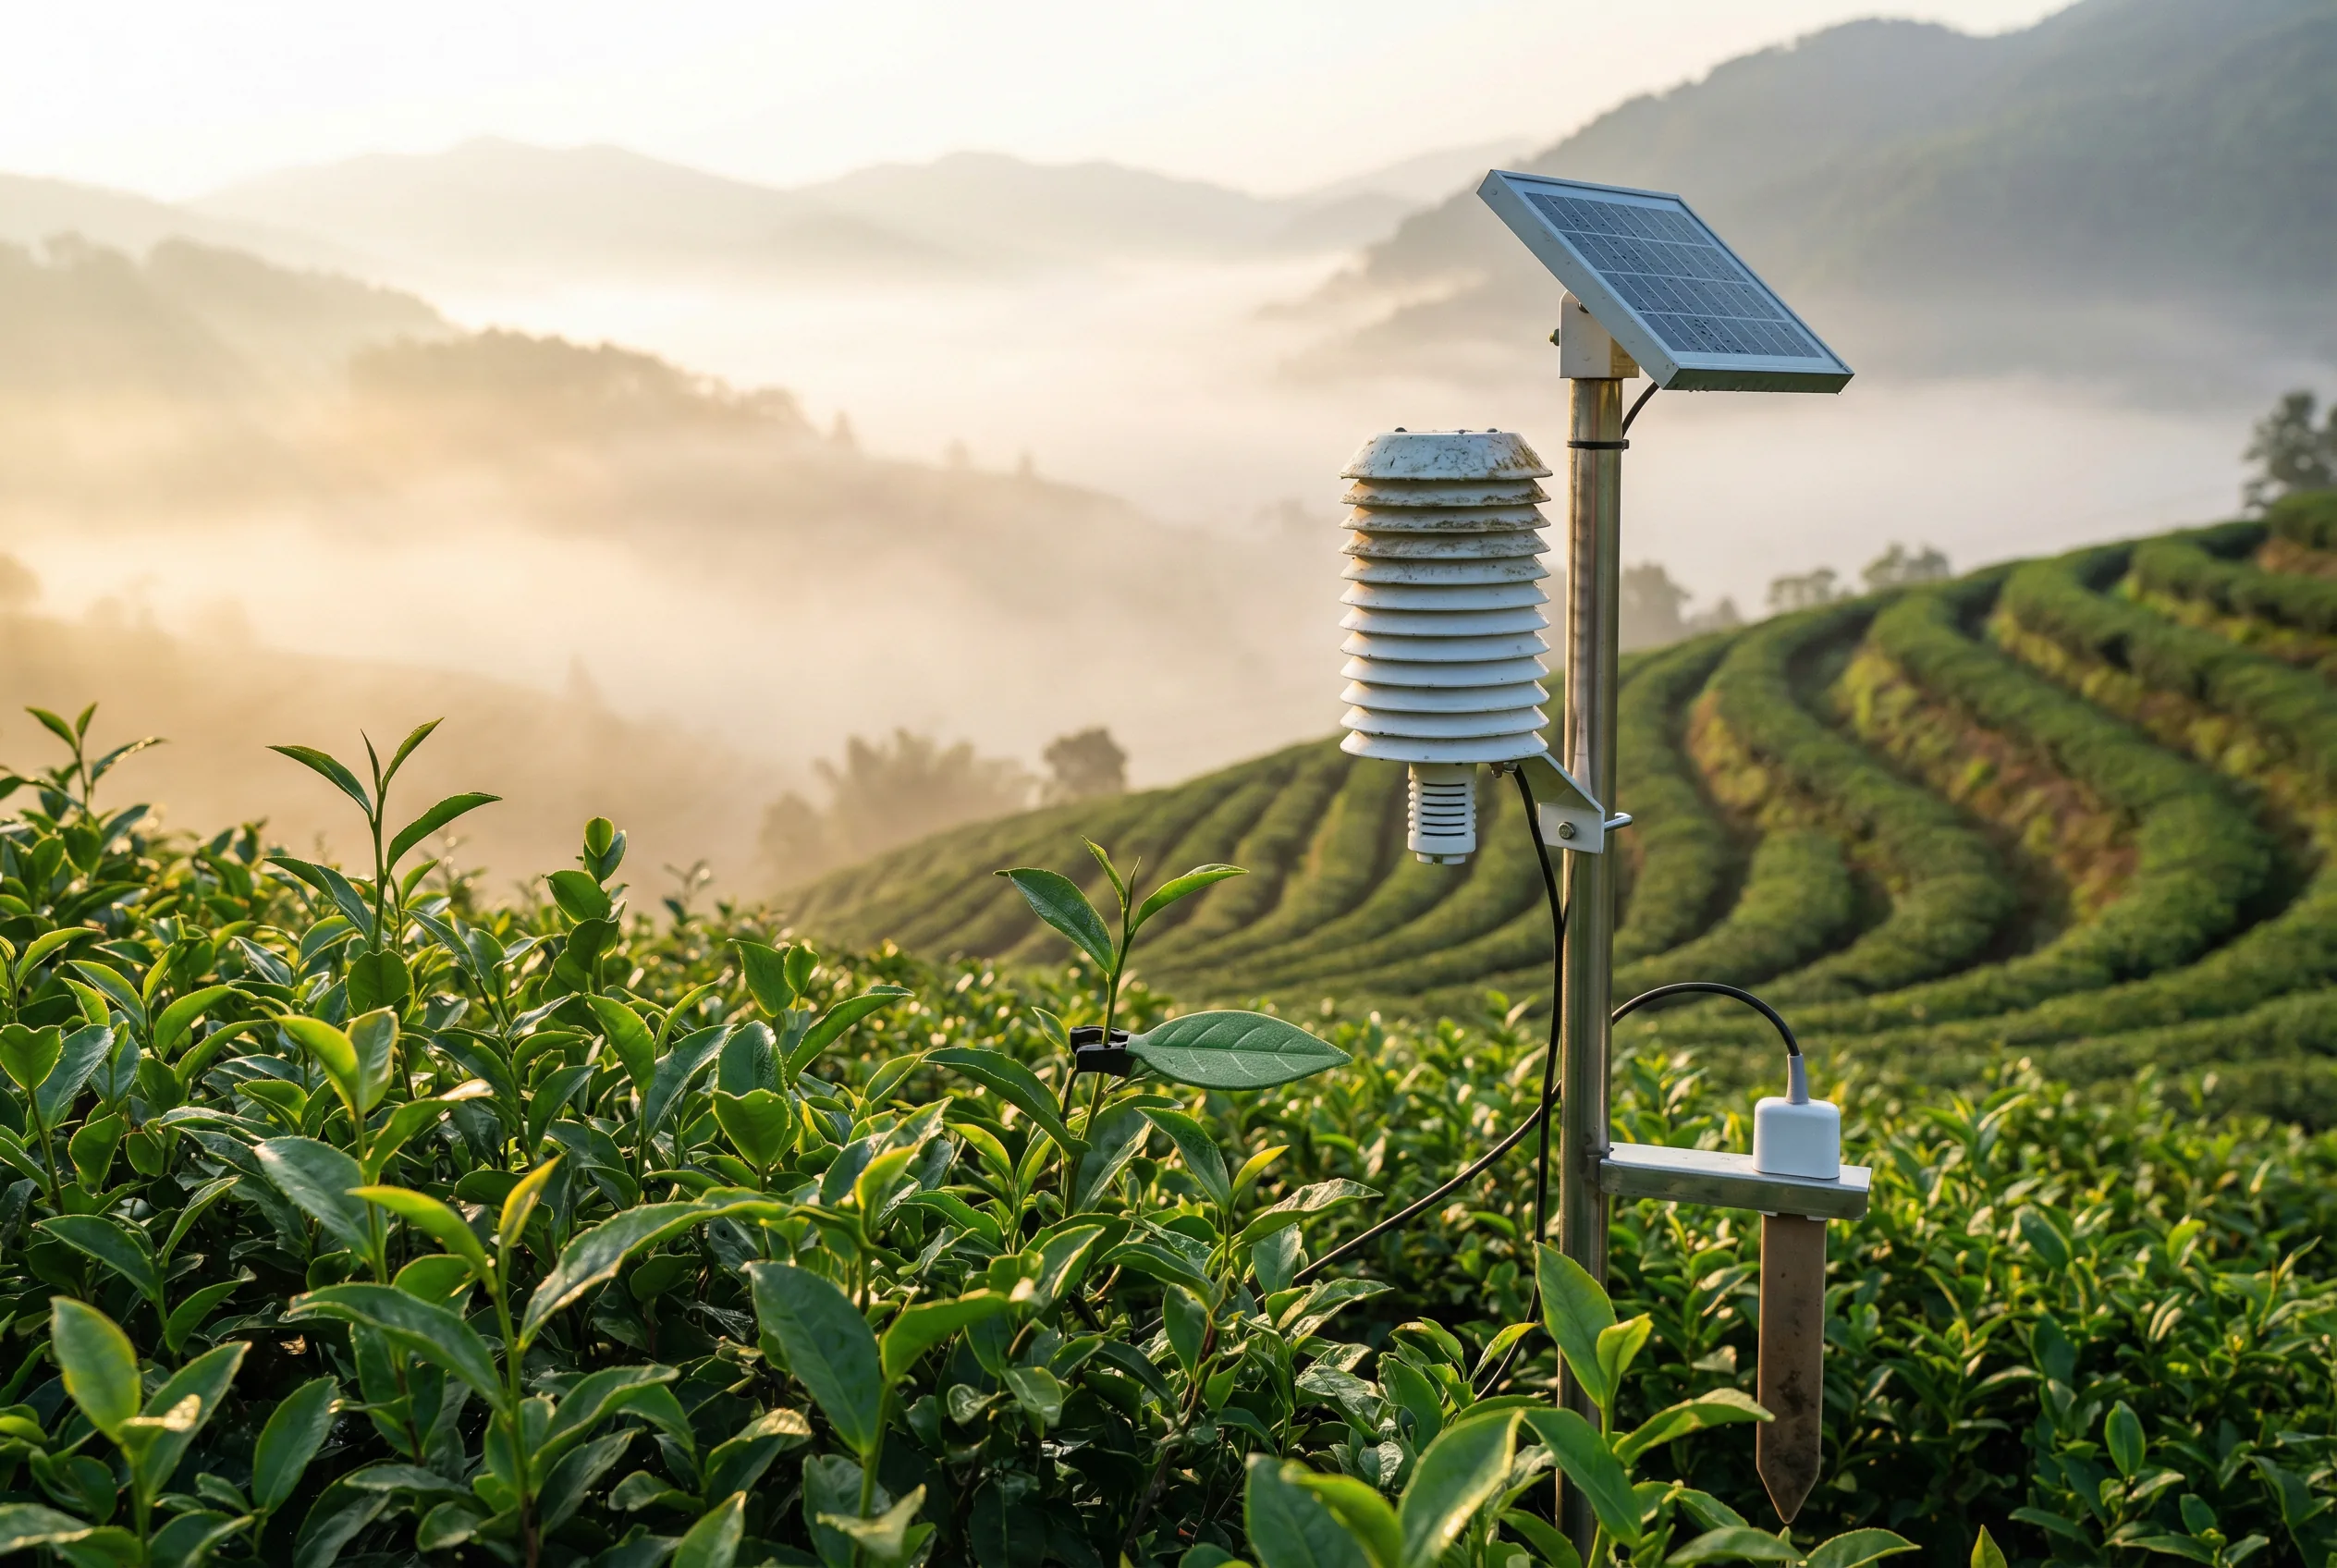
Mountain tea gardens present extreme engineering challenges: steep terrain, frequent fog and high humidity, limited road access for maintenance, and significant elevation-driven temperature gradients. Monitoring stations must be solar-powered with extended battery autonomy (30+ days without sun) due to frequent overcast conditions. Fog detection and leaf wetness are critical for disease risk (gray blight, anthracnose) and harvest timing decisions. Spring frost during the first flush (early April) is a major crop loss risk requiring early warning. The system must operate reliably at 500–2,000 m elevation with ambient temperatures from -10°C to +38°C.
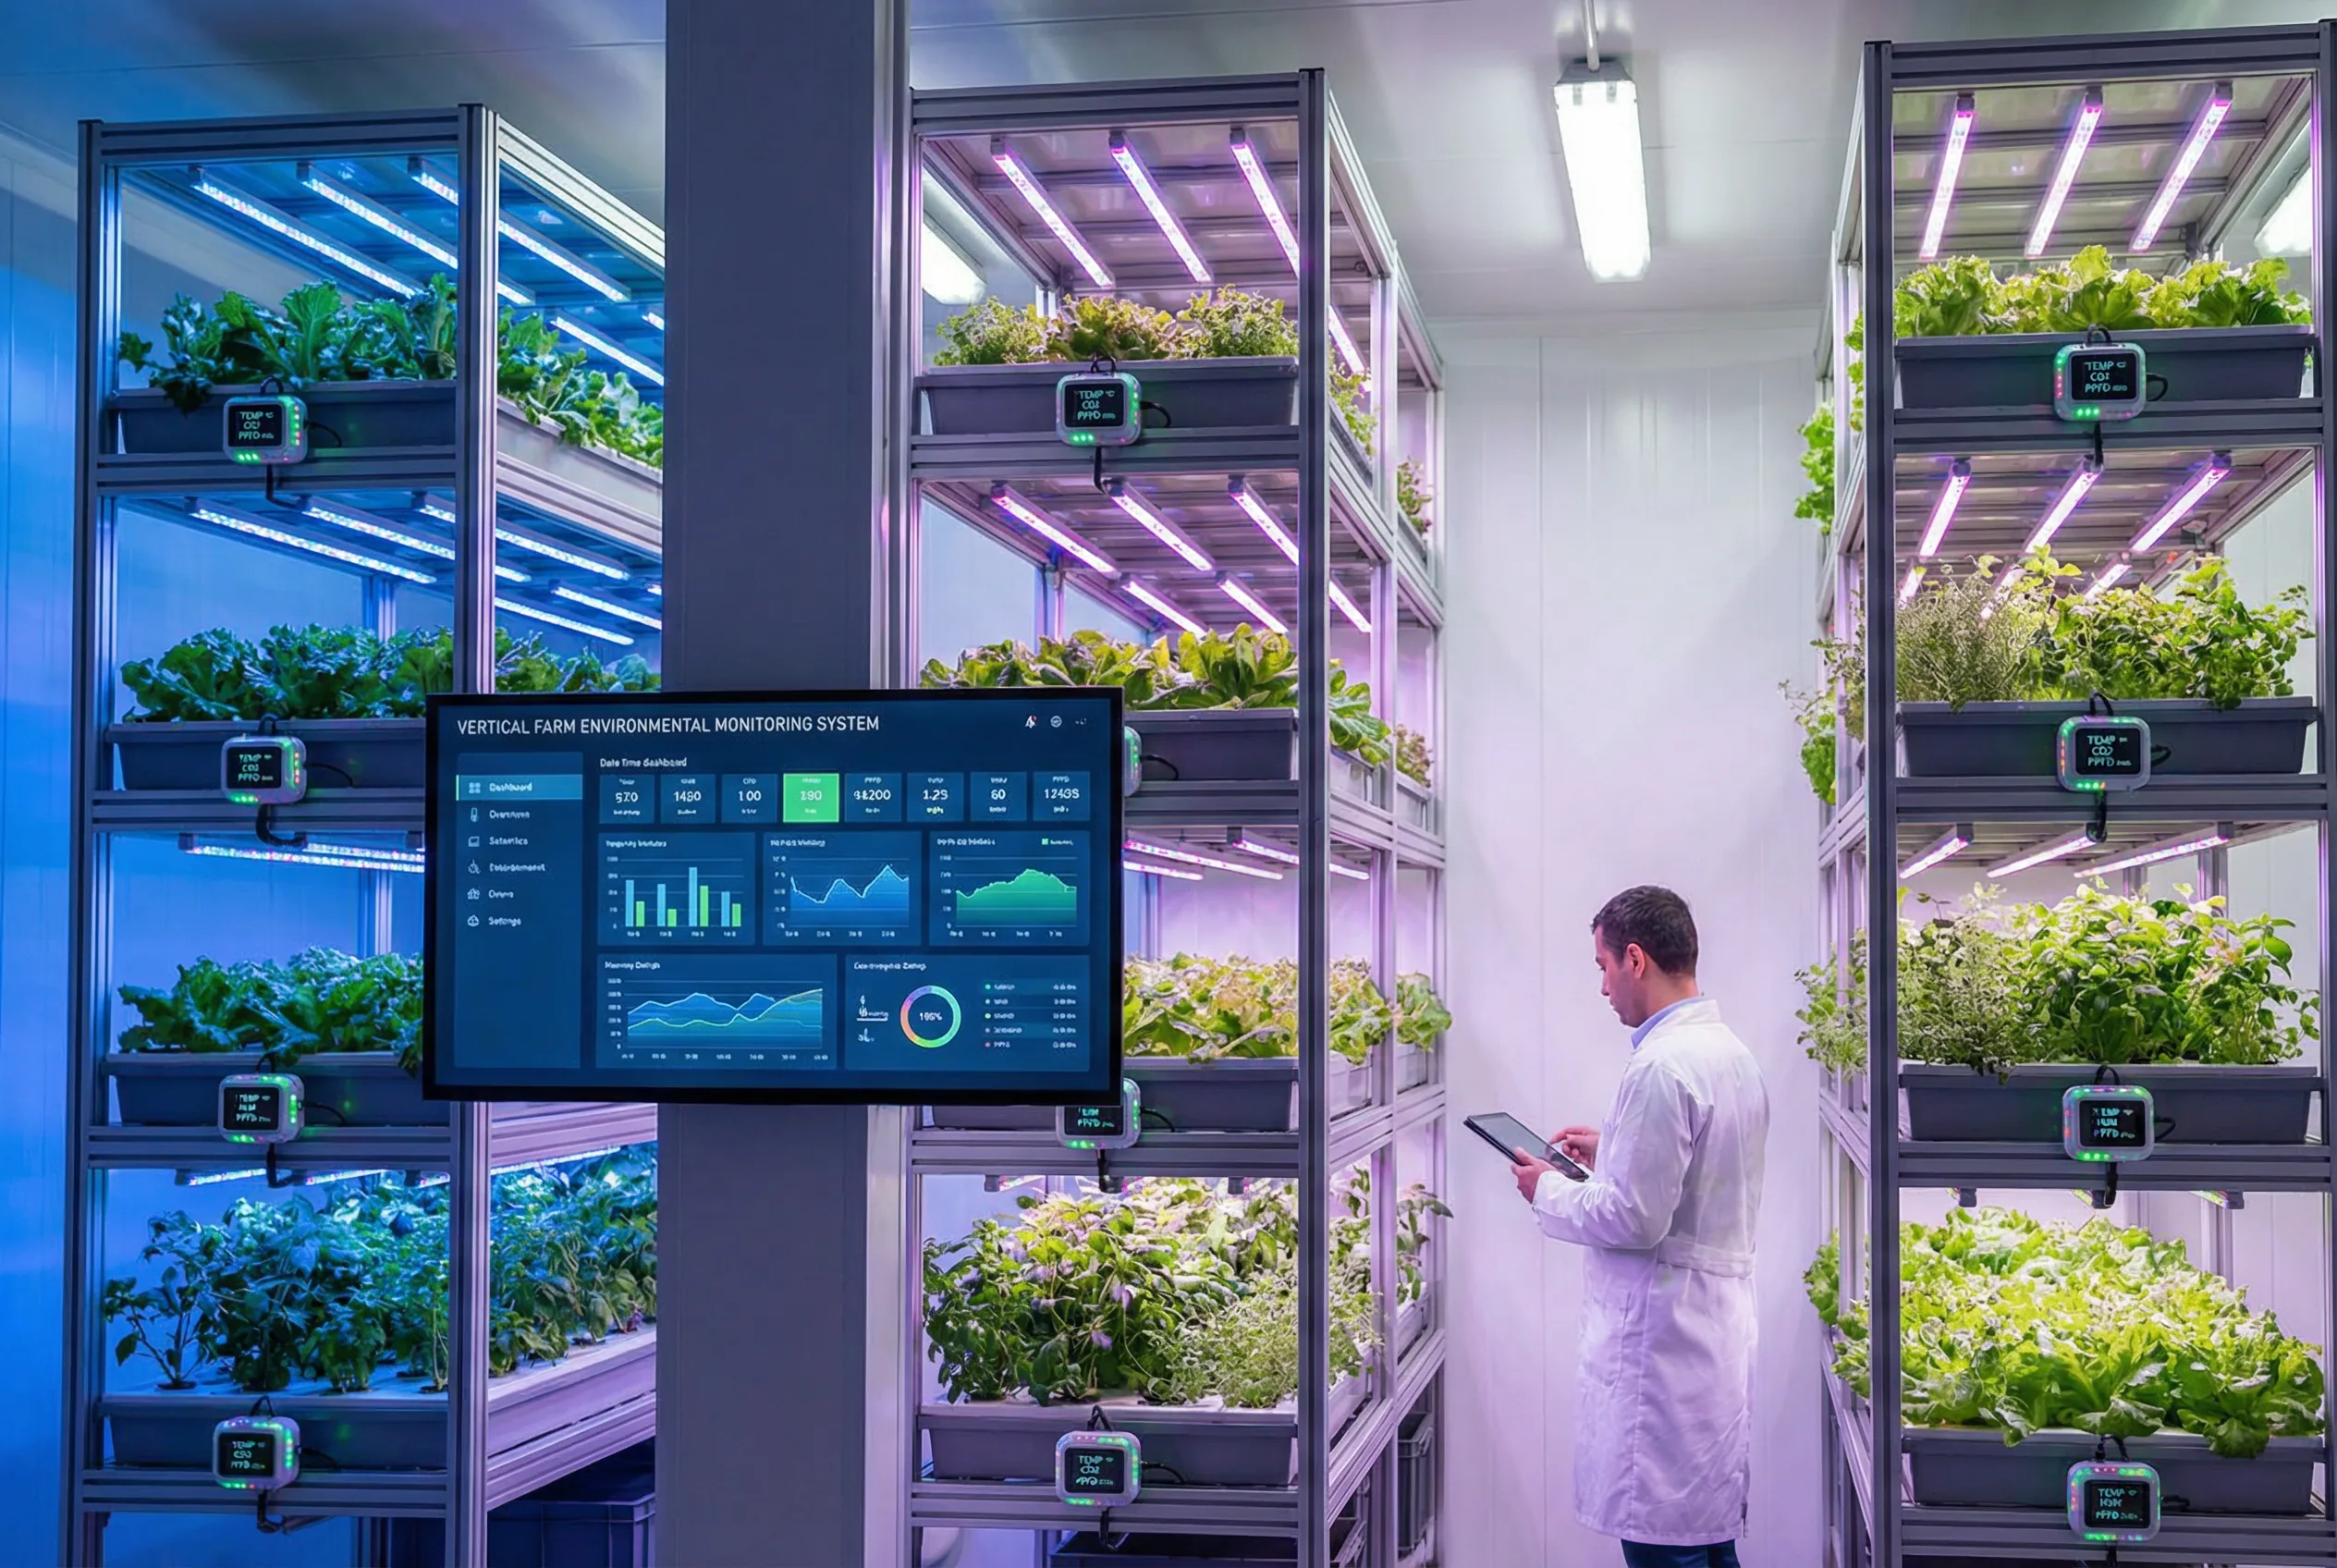
Vertical farms represent the highest-complexity monitoring and control scenario in agriculture. Each growing tier requires independent monitoring of temperature, humidity, CO₂, PPFD, and hydroponic solution parameters (EC, pH, dissolved oxygen). The system controls LED light recipes (spectrum, intensity, photoperiod), HVAC, CO₂ injection, and nutrient dosing in a fully automated closed loop. Data sampling intervals are typically 1 minute or less for critical parameters. Ethernet or Wi-Fi connectivity is used throughout due to the controlled indoor environment. The system must support multi-zone, multi-tier data visualization and alarm management for dozens to hundreds of monitoring points per facility.
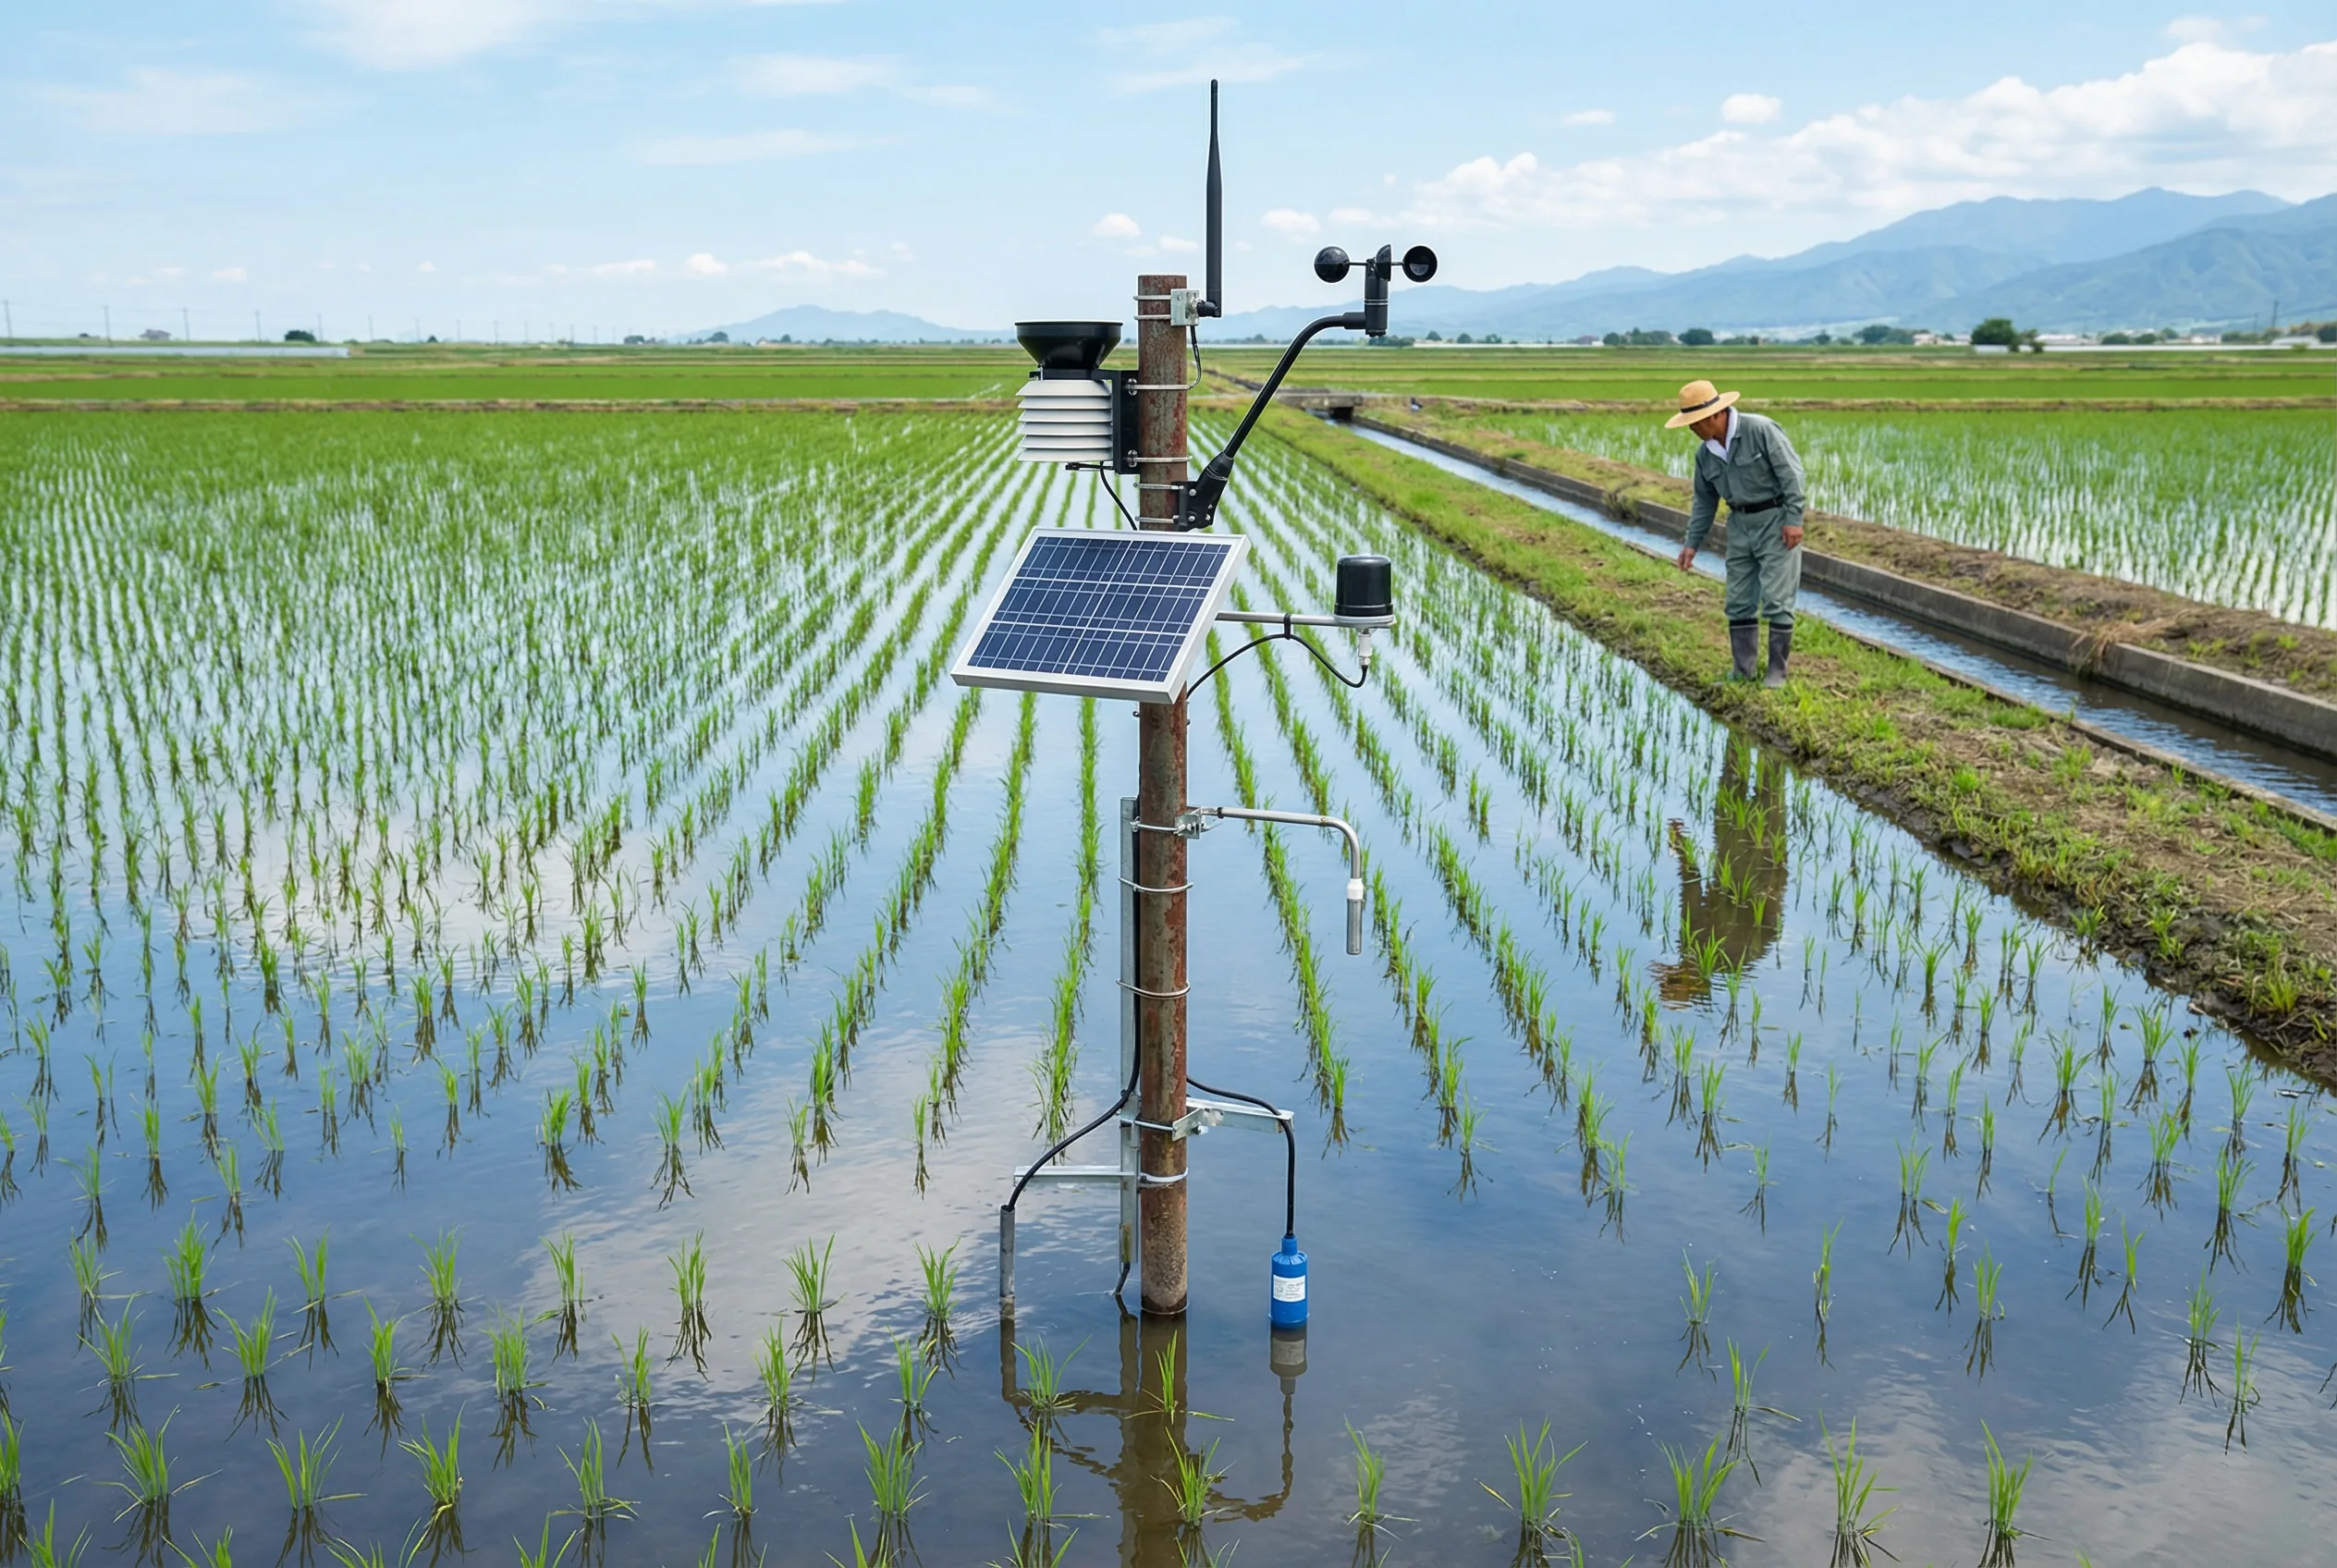
Rice paddy monitoring combines weather station data with water level management for alternate wetting and drying (AWD) irrigation, which reduces water use by 15–30% and methane emissions by 30–50% compared to continuous flooding. The system monitors paddy water level (typically 0–30 cm range), water temperature, soil temperature at root zone, and ambient weather. Solar-powered LoRa or NB-IoT nodes are installed on simple metal poles in the paddy field. The water level sensor must be protected from silt accumulation and algae growth. Flood risk monitoring integrates upstream water level data with local rainfall to trigger early warning for field drainage operations.