Chapter 4: Architecture Design
System topology, network architecture, edge-cloud integration, and device wiring principles for smart agriculture environmental monitoring deployments.
4.1 System Architecture Overview
A well-designed smart agriculture environmental monitoring system follows a four-layer hierarchical architecture that separates physical sensing, local edge processing, network transport, and cloud application concerns. This separation of concerns enables independent scaling, technology refresh, and fault isolation at each layer. The architecture must be designed for the specific constraints of agricultural environments: intermittent connectivity, wide geographic distribution, harsh weather conditions, limited on-site technical support, and the need for reliable real-time alerting.
The following figure presents the complete system network topology, showing the data flow from field sensors through edge gateways to the cloud platform and end-user applications. Understanding this topology is essential before making any component selection or deployment decisions.
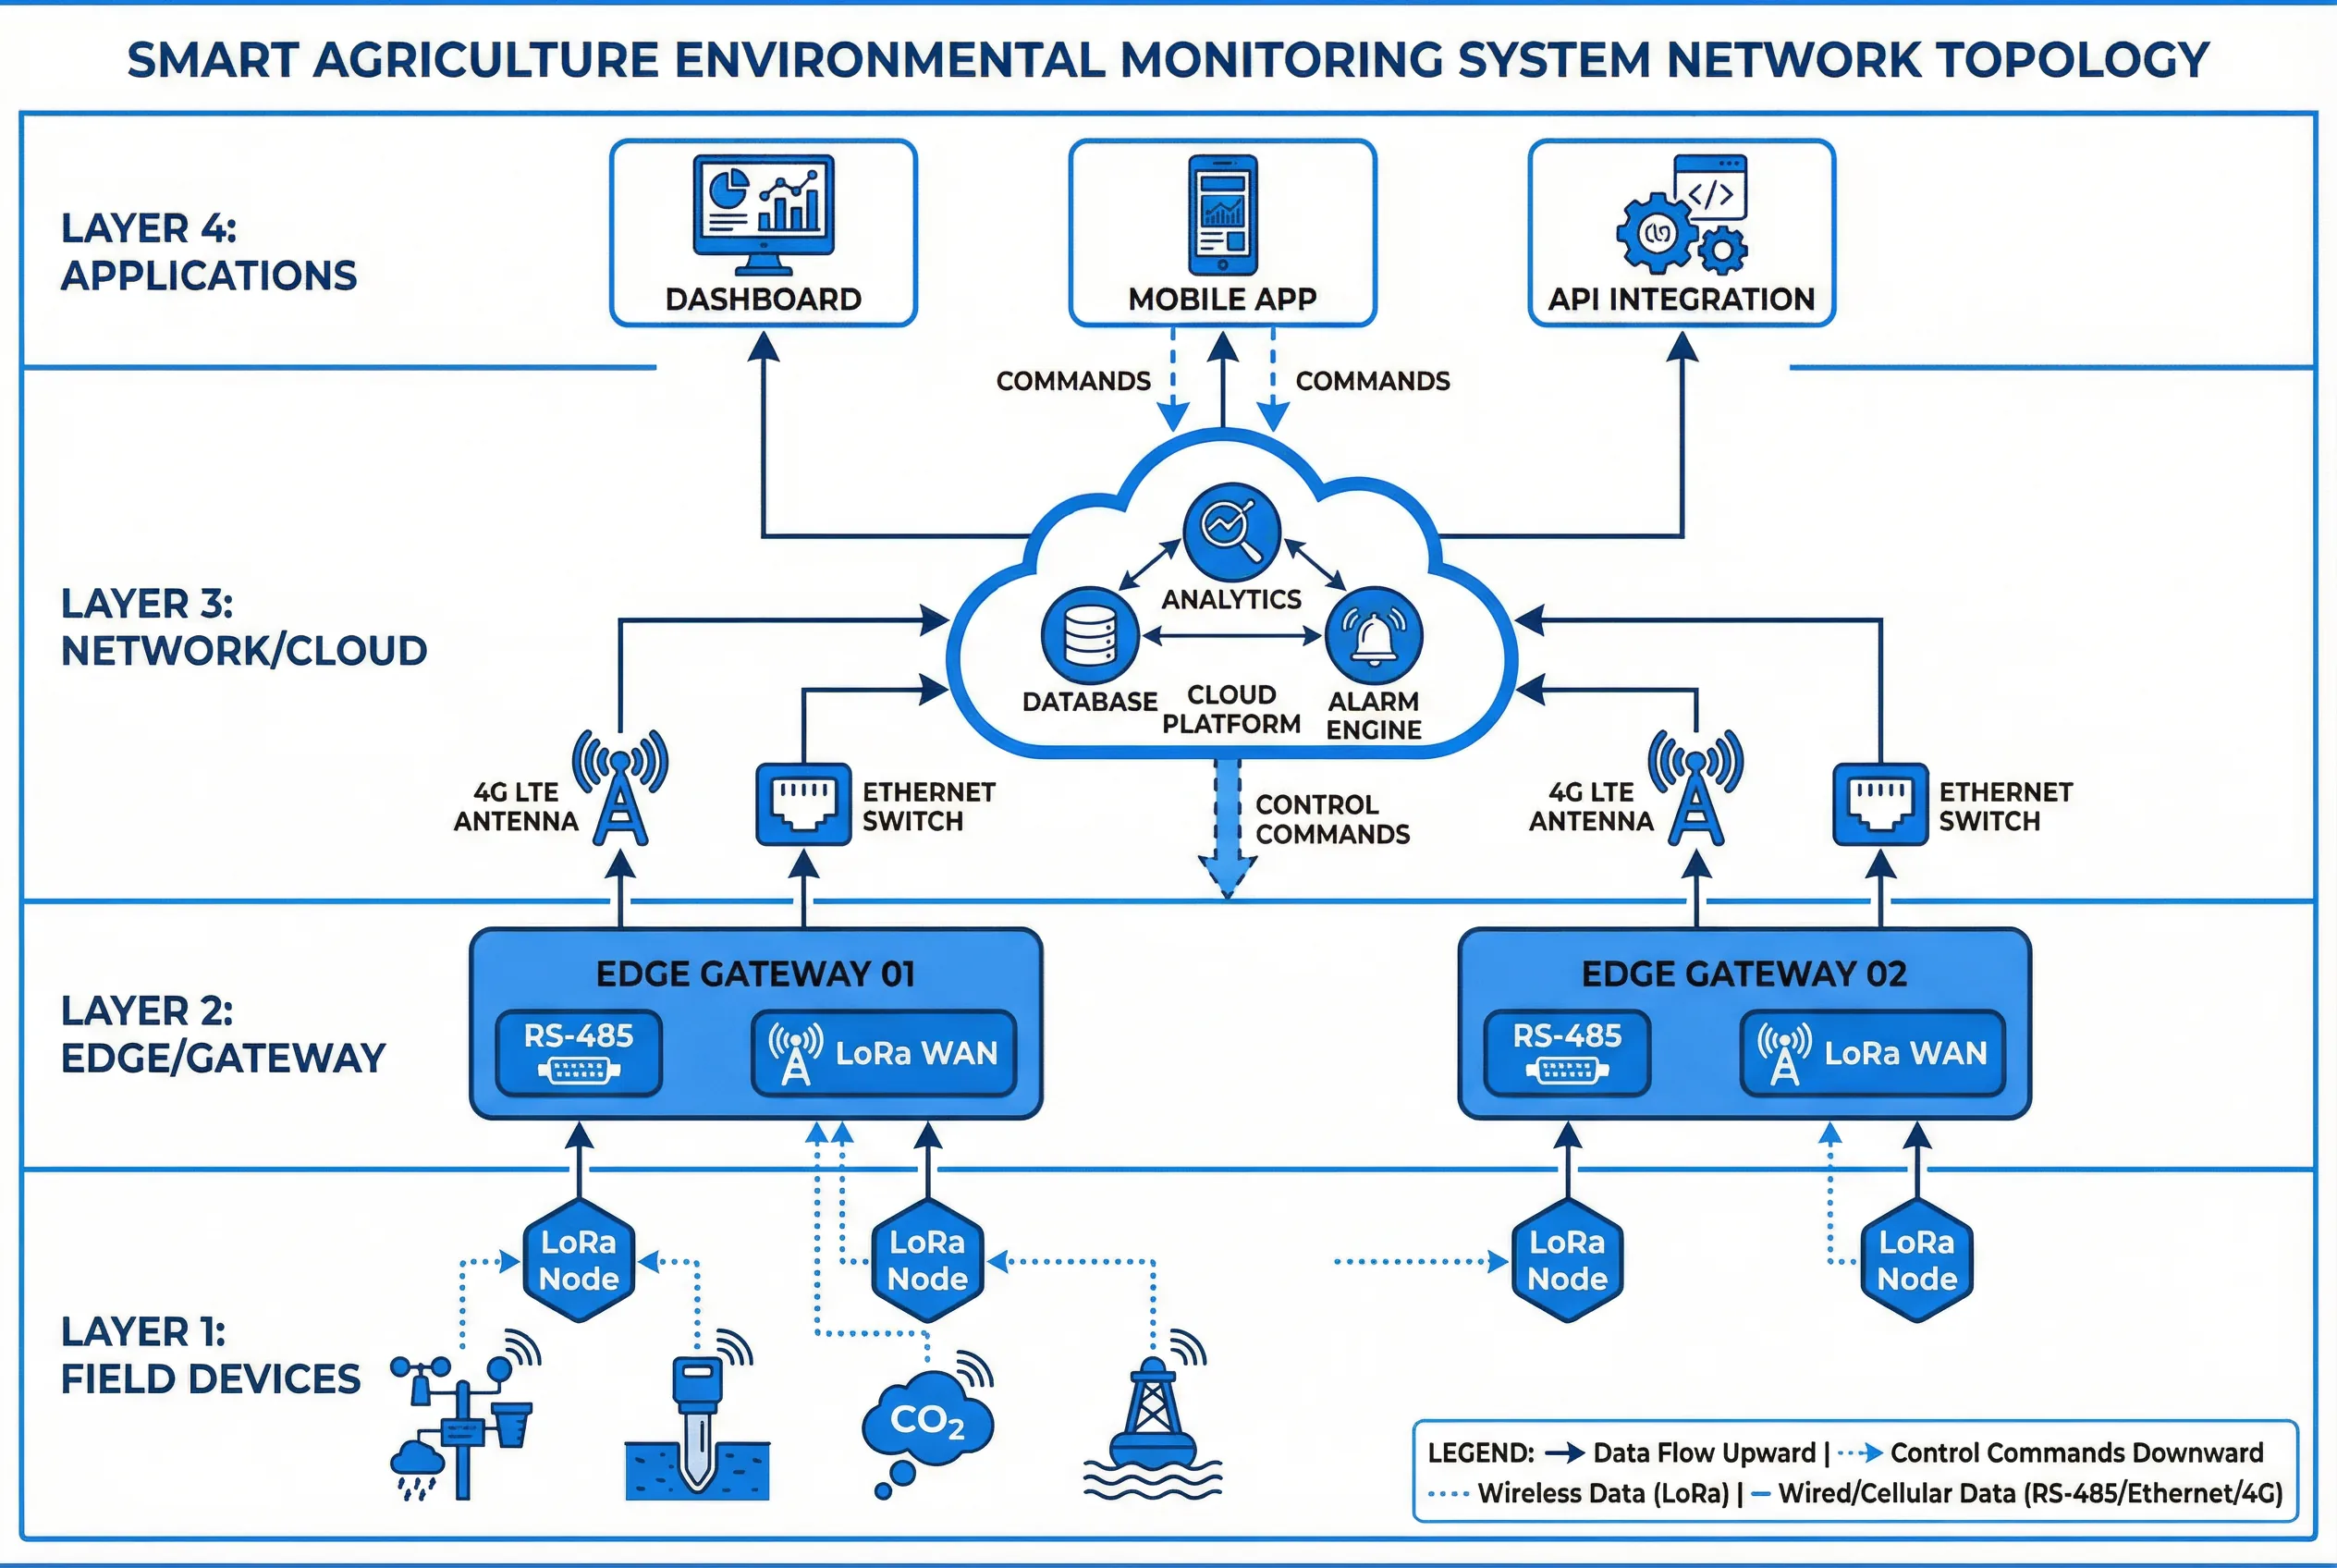
Figure 4.1: Four-Layer Network Topology — Smart Agriculture Environmental Monitoring System
4.1.1 Layer Descriptions
The four architectural layers each serve a distinct engineering purpose. The table below summarizes the key characteristics and design responsibilities of each layer.
| Layer | Name | Key Components | Primary Function | Design Responsibility |
|---|---|---|---|---|
| Layer 1 | Field Devices | Sensors, actuators, LoRa nodes, solar power units | Physical measurement and control | Sensor selection, placement, power design, enclosure rating |
| Layer 2 | Edge / Gateway | Edge RTU, LoRa gateway, local HMI, local storage | Protocol conversion, local logic, data buffering | Gateway sizing, RS-485 topology, edge logic programming |
| Layer 3 | Network / Cloud | 4G/Ethernet backhaul, cloud platform, database, alarm engine | Data aggregation, storage, analytics, alarm management | Cloud platform selection, data model, alarm rule configuration |
| Layer 4 | Applications | Web dashboard, mobile app, API integrations, reports | Visualization, user interaction, third-party integration | Dashboard design, user access control, API documentation |
4.2 Typical System Topology Configurations
Three standard topology configurations cover the majority of smart agriculture deployment scenarios. The choice between configurations depends on site area, number of monitoring points, connectivity availability, and budget constraints. Each configuration has distinct trade-offs in terms of reliability, cost, and maintenance complexity.
4.2.1 Configuration A — Small-Scale Wired (Greenhouse / Indoor)
This configuration is appropriate for greenhouse and indoor farming environments where all sensors are within 1,200 m of the gateway and grid power is available. RS-485 Modbus RTU wired bus connects all sensors to the edge gateway. The gateway uploads data via Ethernet or 4G to the cloud platform. This configuration provides the highest reliability and lowest latency, with no wireless interference concerns.
- RS-485 bus length: up to 1,200 m (with proper termination and shielding)
- Maximum devices per bus segment: 32 (standard) or 128 (with repeaters)
- Recommended baud rate: 9,600 or 19,200 bps for agricultural sensors
- Power supply: 12V or 24V DC regulated, with UPS backup for critical systems
4.2.2 Configuration B — Hybrid Wireless + Wired (Medium Farm)
This configuration combines RS-485 wired sensors near the gateway with LoRa wireless nodes for remote field locations. The edge gateway acts as both an RS-485 master and a LoRa network server. This is the most common configuration for farms of 5–500 ha with mixed greenhouse and open-field monitoring requirements.
- LoRa coverage radius: 2–5 km (line-of-sight), 0.5–2 km (with vegetation)
- LoRa network capacity: up to 1,000 nodes per gateway (with proper spreading factor management)
- Recommended LoRa spreading factor: SF7–SF10 (balance between range and data rate)
- Gateway backhaul: 4G LTE primary, Ethernet secondary (where available)
4.2.3 Configuration C — Fully Wireless Distributed (Large Farm / Pasture)
For large-scale deployments exceeding 500 ha, a fully wireless architecture with multiple LoRa gateways or NB-IoT nodes is required. Each monitoring node operates independently with solar power and cellular or LoRa backhaul. A central cloud platform aggregates data from all nodes. This configuration requires careful RF planning and battery sizing.
- NB-IoT coverage: relies on carrier network (check coverage maps before deployment)
- Battery life target: ≥12 months at 15-minute reporting interval
- Solar panel sizing: minimum 10W with 3-day battery backup (cloudy weather reserve)
- Node density: 1 node per 5–50 ha depending on crop type and monitoring objectives
4.3 Device Wiring Design
Correct wiring is fundamental to system reliability. Poor wiring is the leading cause of field failures in agricultural monitoring systems, accounting for over 60% of maintenance calls in the first year of operation. The wiring diagram below illustrates the standard connection scheme for a typical edge gateway with RS-485 sensors and relay-controlled actuators.
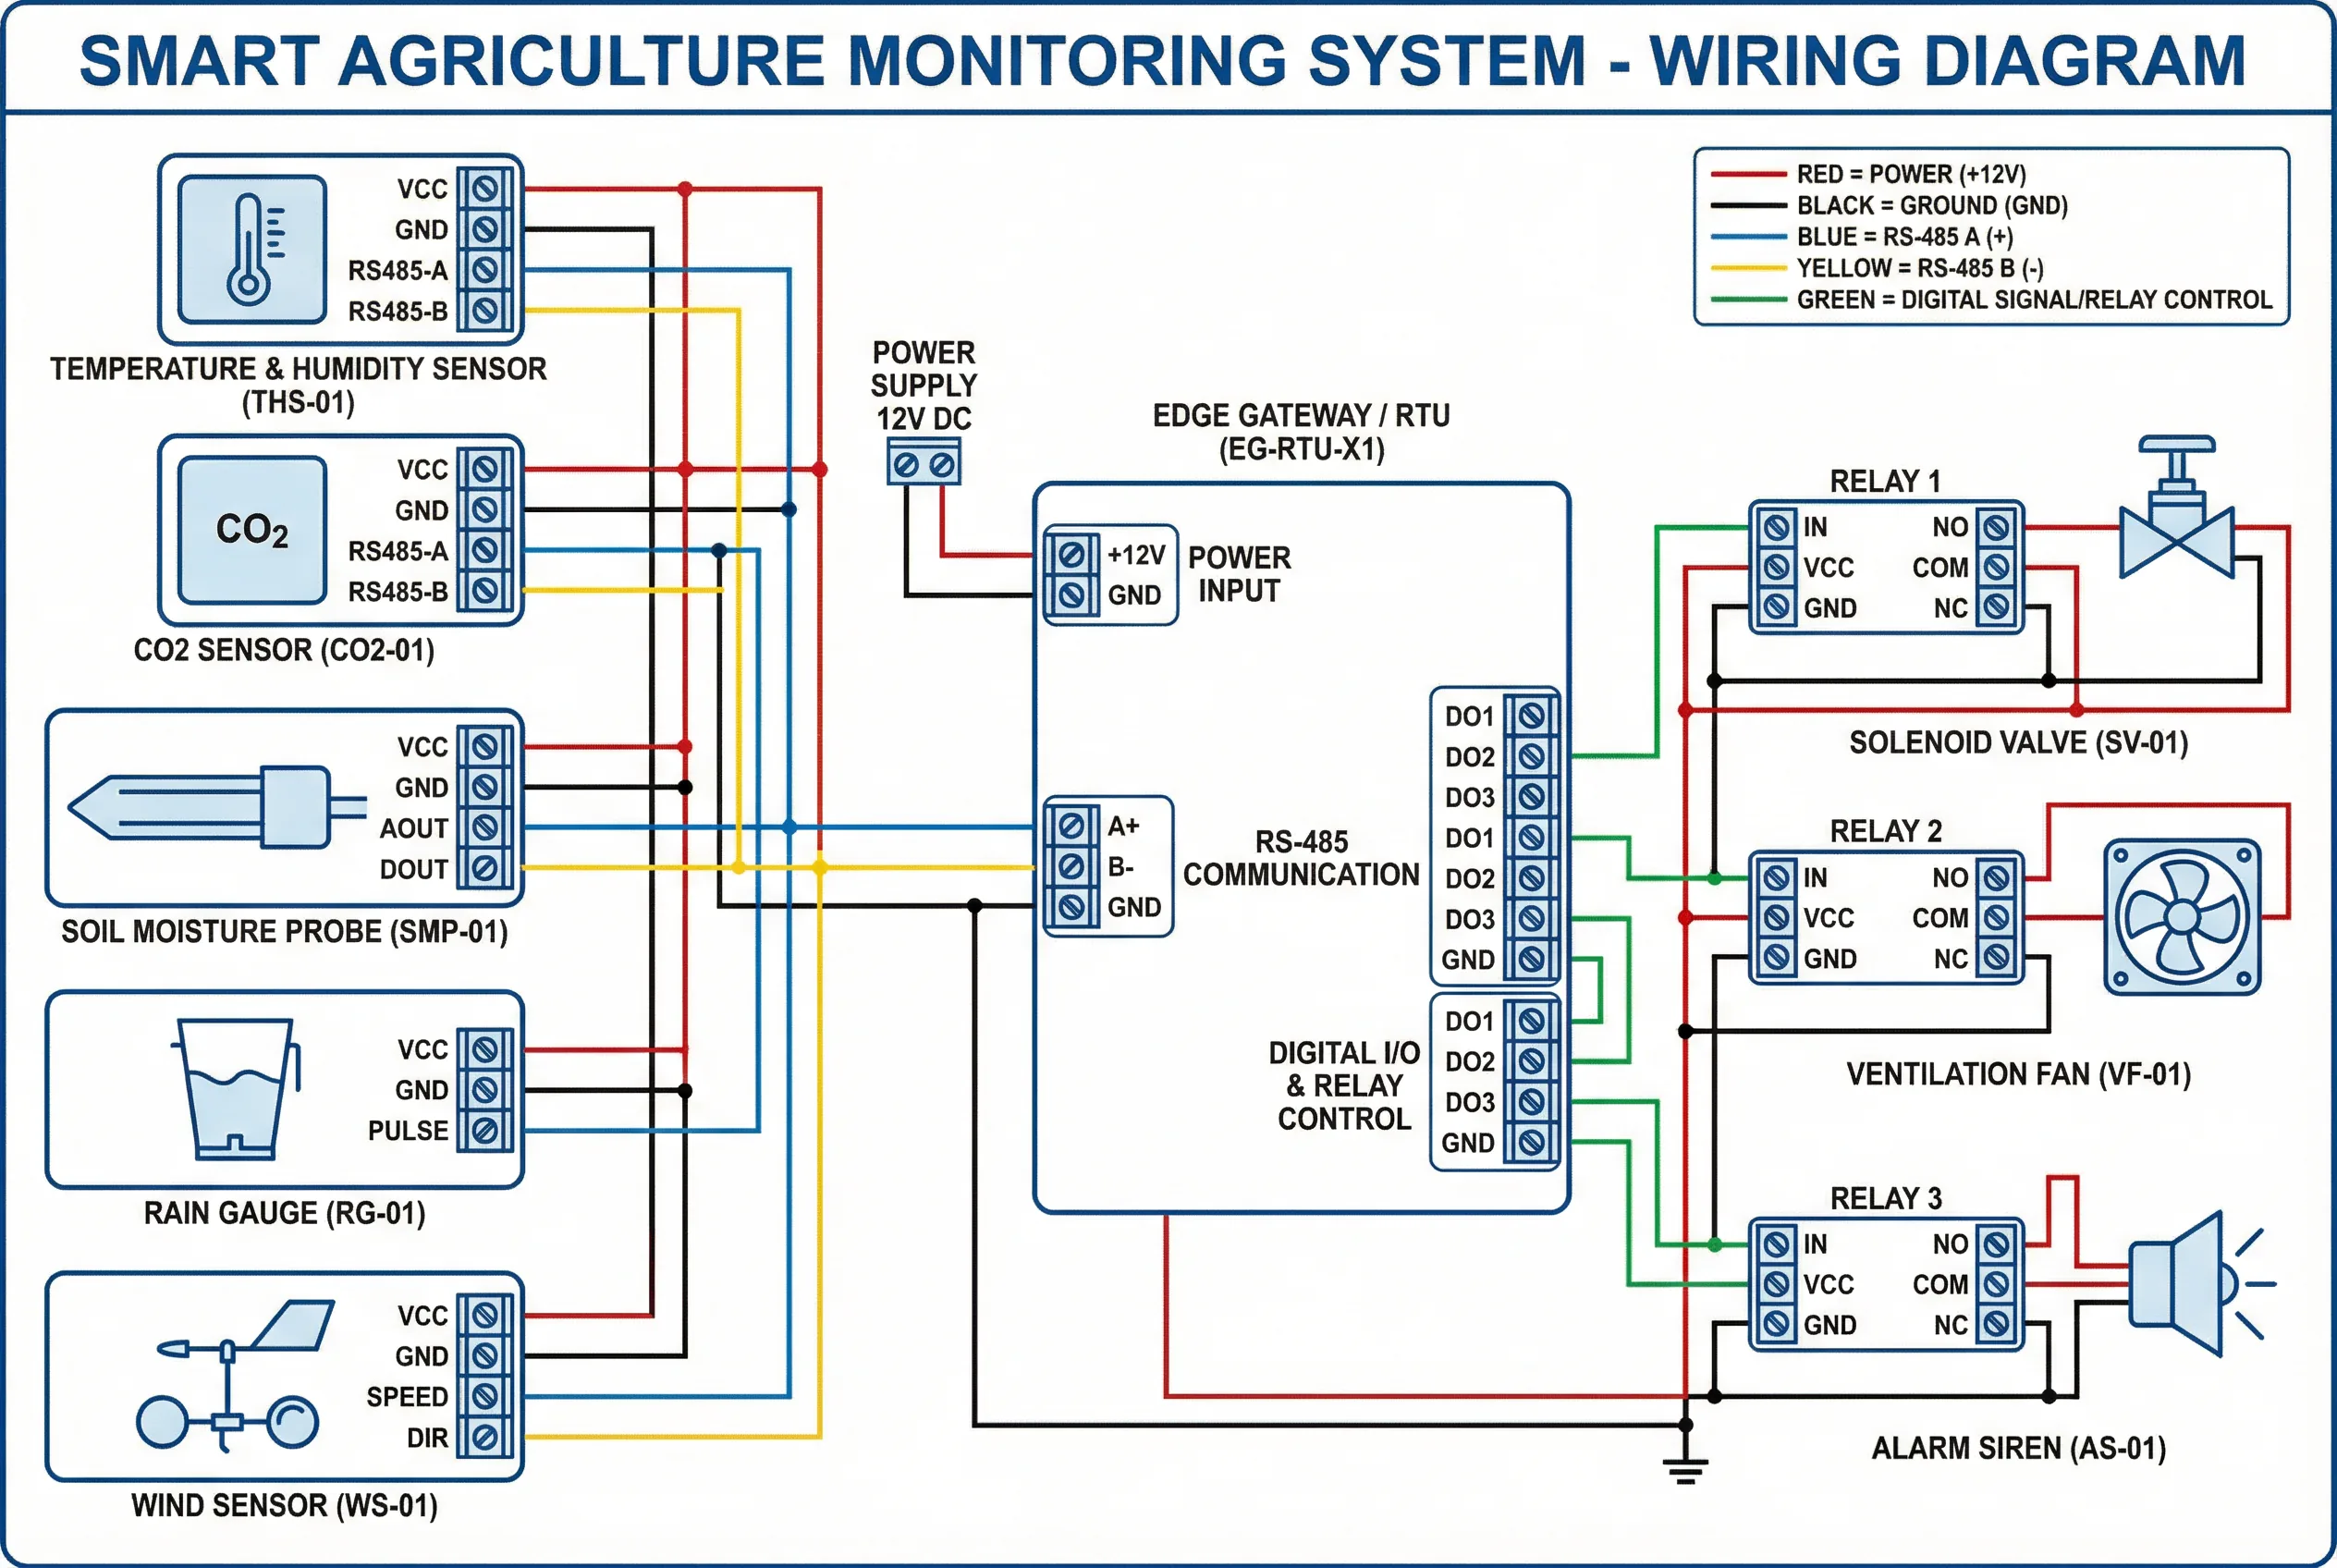
Figure 4.2: Device Wiring Diagram — Edge Gateway, RS-485 Sensors, and Relay-Controlled Actuators
4.3.1 RS-485 Bus Wiring Rules
RS-485 is the dominant wired communication standard for agricultural sensor networks due to its noise immunity, long cable runs, and multi-drop capability. Adherence to the following wiring rules is mandatory for reliable operation.
| Rule | Specification | Consequence of Violation |
|---|---|---|
| Cable type | Twisted pair, shielded (STP), 24 AWG minimum | High noise susceptibility, communication errors |
| Bus topology | Daisy-chain (linear), NOT star topology | Signal reflections, intermittent failures |
| Termination resistor | 120 Ω at both ends of the bus | Signal reflections at high baud rates |
| Shield grounding | Ground shield at ONE end only (gateway end) | Ground loop currents, increased noise |
| Maximum cable length | 1,200 m at 9,600 bps; 300 m at 115,200 bps | Signal degradation, communication loss |
| Node addressing | Unique Modbus address 1–247 per device | Address conflicts, data corruption |
| Biasing resistors | 560 Ω pull-up/pull-down at gateway end | Bus floating state errors during idle |
| Cable separation | ≥200 mm from power cables (AC lines) | Induced interference, data errors |
4.3.2 Power Wiring and Grounding
Power supply quality directly affects sensor accuracy and system reliability. All sensors should be powered from a regulated DC supply with sufficient current headroom. A common grounding point (single-point ground) prevents ground loops that can introduce measurement errors of several degrees Celsius in temperature sensors. For outdoor installations, surge protection devices (SPDs) must be installed on all power and communication lines entering the gateway enclosure.
Best Practice: Install a 12V/24V DC power distribution block inside the gateway enclosure with individual fused outputs for each sensor circuit. This simplifies troubleshooting and prevents a single sensor fault from affecting the entire system.
4.4 Edge-Cloud Integration Architecture
The edge gateway serves as the critical integration point between field devices and the cloud platform. Its software architecture must support local data buffering (to handle connectivity outages), edge alarm logic (for time-critical alerts that cannot wait for cloud round-trip), and secure encrypted communication to the cloud platform.
| Function | Edge (Gateway) | Cloud Platform | Rationale |
|---|---|---|---|
| Data collection | Primary (Modbus polling) | Receive only | Minimize latency, reduce bandwidth |
| Local alarms | Primary (threshold-based) | Secondary (complex rules) | Sub-minute response for critical alerts |
| Data storage | 7-day buffer (SD card) | Long-term (years) | Offline resilience + historical analysis |
| Control logic | Primary (PID, schedules) | Supervisory override | Reliable control without cloud dependency |
| OTA updates | Receive firmware updates | Distribute updates | Centralized management |
| Data protocol | Modbus RTU (field side) | MQTT / HTTP (cloud side) | Protocol translation at edge |
4.5 Communication Technology Selection
The selection of communication technology for each deployment layer requires careful evaluation of coverage requirements, data volume, power constraints, and total cost of ownership. The table below provides a structured comparison of the primary options available for agricultural IoT deployments.
| Technology | Range | Data Rate | Power | Cost | Best Use Case |
|---|---|---|---|---|---|
| RS-485 (Modbus) | 1,200 m | 115 kbps | Low | Very Low | Greenhouse, indoor, wired zones |
| LoRa (915/868 MHz) | 2–15 km | 0.3–50 kbps | Very Low | Low | Open-field, orchard, large farms |
| NB-IoT | Carrier network | ~200 kbps | Very Low | Medium (SIM fees) | Remote areas with carrier coverage |
| 4G LTE | Carrier network | 10–100 Mbps | Medium | Medium (SIM fees) | Gateway backhaul, video, high data |
| Wi-Fi (2.4/5 GHz) | 50–150 m | 10–600 Mbps | Medium | Very Low | Indoor farms, buildings |
| Ethernet | 100 m | 100–1,000 Mbps | Low | Low | Greenhouse, indoor, fixed installations |