Chapter 5: Selection & Interfaces
Core product selection guide, interface specifications, connection logic, and feature comparison tables for smart agriculture monitoring hardware.
5.1 Core Product Portfolio Overview
A complete smart agriculture environmental monitoring system is built from six categories of core hardware products. Each category serves a specific function in the sensing-to-cloud data chain. The image below shows the six core product types in their physical form, providing a visual reference for procurement and field identification.
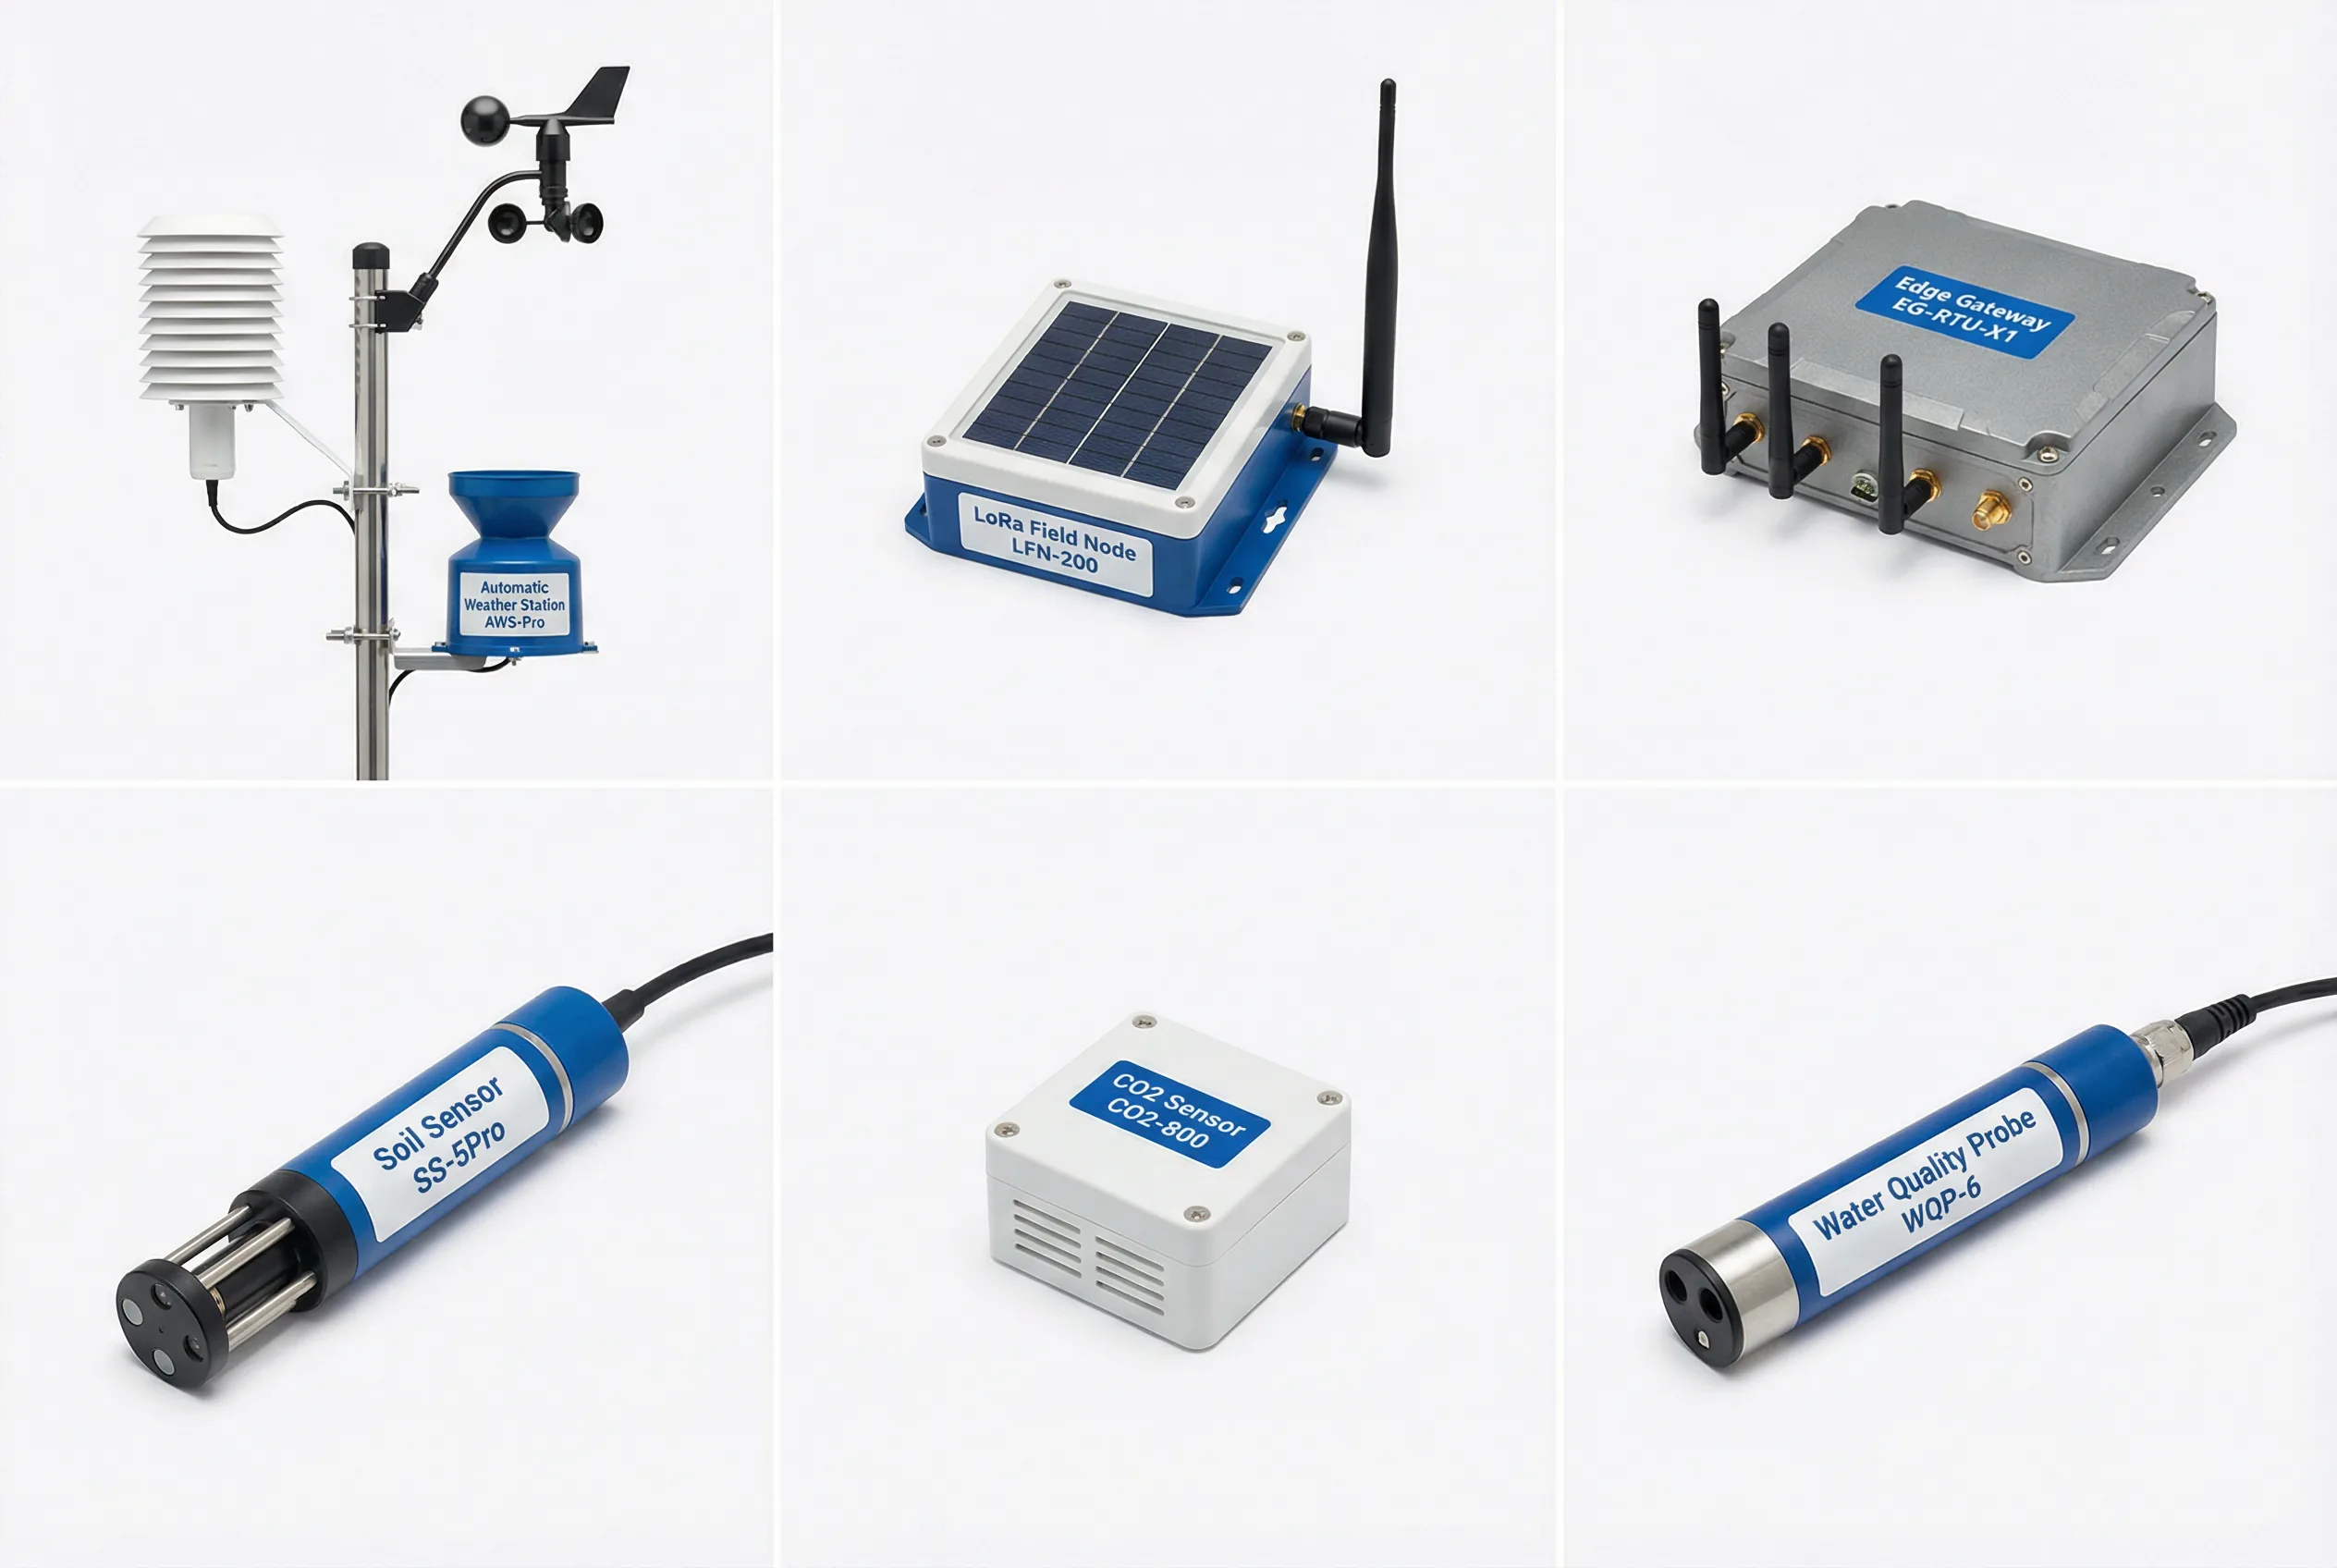
Figure 5.1: Core Product Portfolio — Six Hardware Categories for Smart Agriculture Monitoring Systems
The six core product categories are: (1) Automatic Weather Station (AWS), (2) LoRa Field Node, (3) Edge Gateway / RTU, (4) Multi-parameter Soil Sensor, (5) CO₂ and Air Quality Sensor, and (6) Water Quality Multiparameter Probe. Each product must be selected to match the specific requirements of the deployment scenario, as detailed in the subsections below.
5.2 Interface Connection Logic
Understanding the interface connection logic of the edge gateway is essential for correct system integration. The gateway serves as the central hub connecting field sensors (via RS-485 and analog inputs), actuators (via relay outputs), and the cloud platform (via 4G/Ethernet). The diagram below illustrates the complete interface logic of a typical agricultural edge gateway.
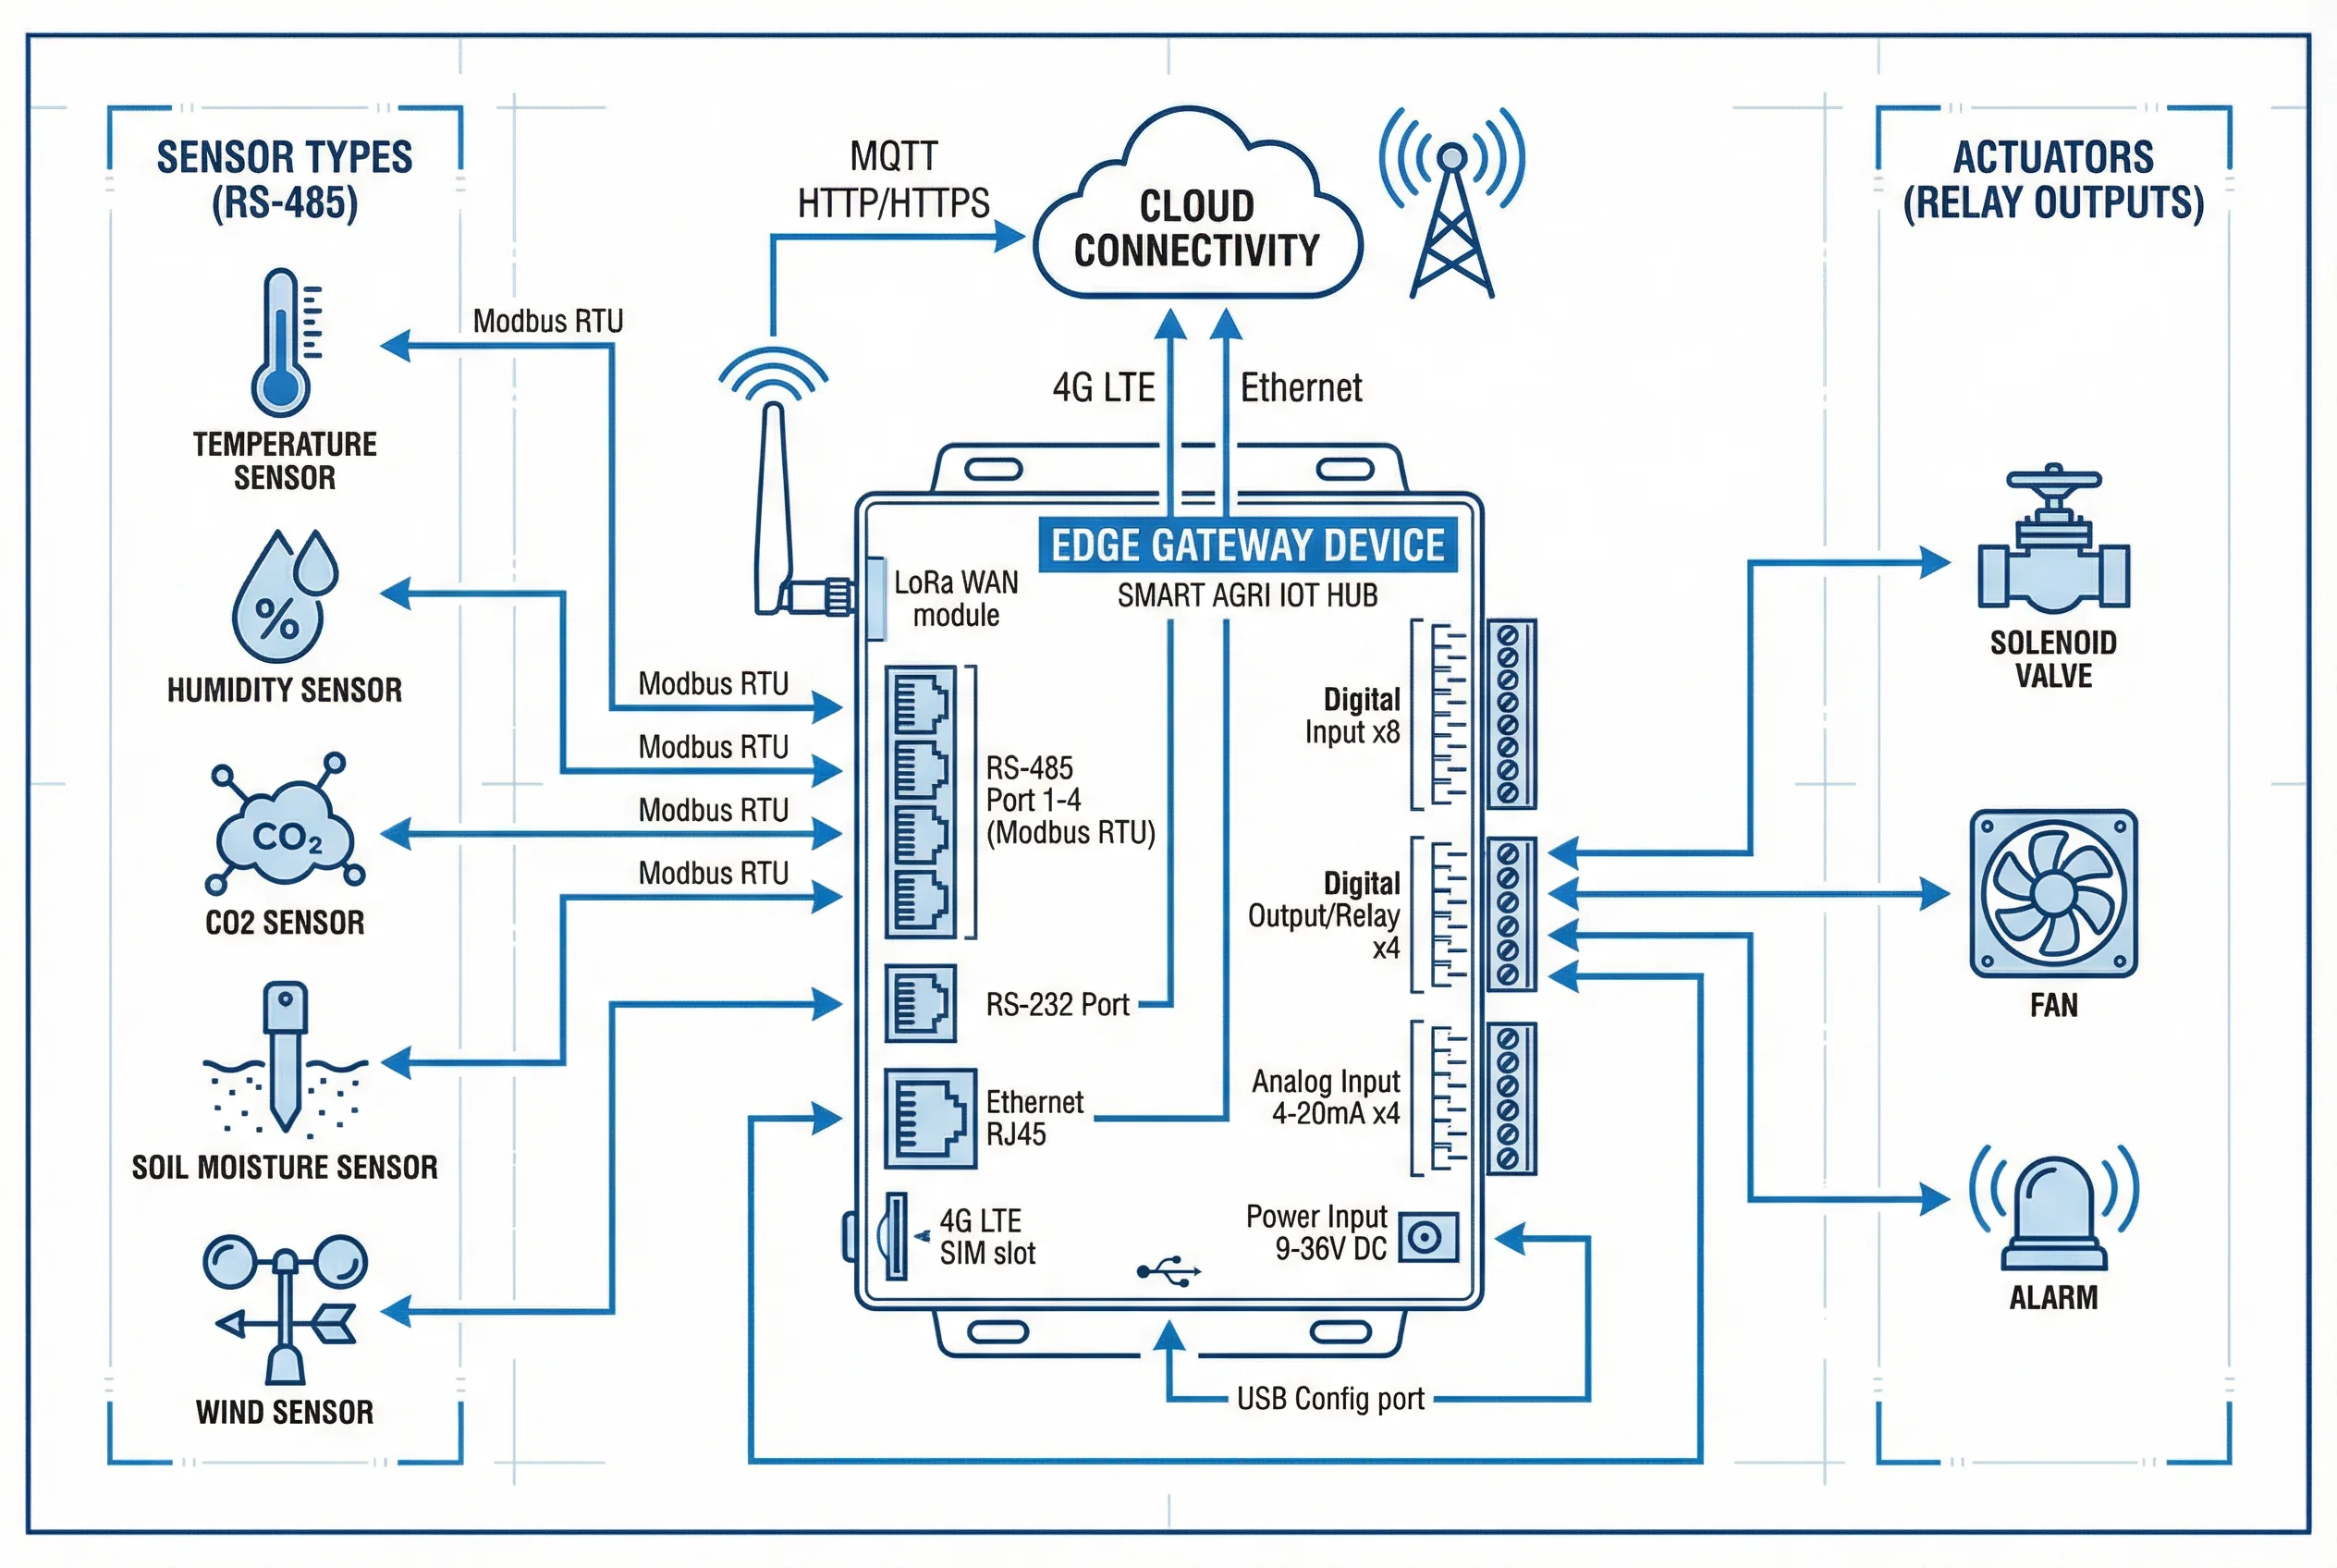
Figure 5.2: Edge Gateway Interface Logic — Sensor Inputs, Actuator Outputs, and Cloud Connectivity
5.2.1 Interface Specifications Summary
The table below provides a complete specification of all gateway interfaces, including electrical characteristics, protocol support, and maximum load ratings. These specifications must be verified against sensor and actuator requirements before finalizing the system design.
| Interface | Type | Quantity | Electrical Spec | Protocol | Max Load / Range |
|---|---|---|---|---|---|
| RS-485 Ports | Sensor input | 4 (isolated) | ±15V common mode | Modbus RTU | 32 devices per port |
| RS-232 Port | Serial config | 1 | ±12V, 3-wire | AT commands / config | 1 device |
| Ethernet RJ45 | Network | 1 | 10/100 Mbps | MQTT / HTTP / Modbus TCP | N/A |
| 4G LTE SIM | Cellular | 1 (Nano SIM) | LTE Cat-1 / Cat-4 | MQTT / HTTP | N/A |
| LoRa WAN | Wireless | 1 (internal) | 868/915 MHz, 20 dBm | LoRaWAN Class A/C | 1,000 nodes |
| Digital Input | Pulse / status | 8 channels | 5–30V DC, NPN/PNP | Pulse count / state | 10 kHz max pulse |
| Relay Output | Actuator control | 4 channels | 250V AC / 30V DC | On/Off / PWM | 10A per relay |
| Analog Input | 4–20 mA sensors | 4 channels | 0–20 mA, 12-bit ADC | Direct measurement | ±0.1% full scale |
| Power Input | DC power | 1 | 9–36V DC wide range | N/A | 15W max consumption |
| USB Config | Configuration | 1 (Micro-USB) | USB 2.0 | Virtual COM port | Config only |
5.3 Core Product Feature Comparison Table
The following table presents a comprehensive feature comparison of the six core product categories, covering measurement parameters, accuracy, communication interfaces, power requirements, environmental ratings, and key selection criteria. This table serves as the primary reference for product selection decisions.
| Feature | Weather Station AWS-Pro | LoRa Field Node LFN-200 | Edge Gateway EG-RTU-X1 | Soil Sensor SS-5Pro | CO₂ Sensor CO2-800 | Water Quality WQP-6 |
|---|---|---|---|---|---|---|
| Primary Parameters | T, RH, Wind Speed, Wind Dir, Rain, Solar Rad, Pressure | T, RH, Soil VWC, Soil T (configurable sensors) | Data aggregation, protocol conversion, control | VWC, Soil T, EC, pH, N/P/K (5-in-1) | CO₂ (NDIR), T, RH, TVOC, PM2.5 (optional) | DO, pH, Turbidity, Water T, EC, ORP |
| Accuracy (Key Param) | T: ±0.3°C; RH: ±2%; Wind: ±0.3 m/s | T: ±0.5°C; VWC: ±3% (calibrated) | N/A (gateway device) | VWC: ±2%; EC: ±2%; T: ±0.5°C | CO₂: ±50 ppm + 3%; T: ±0.3°C | DO: ±0.1 mg/L; pH: ±0.05; T: ±0.1°C |
| Communication | RS-485 Modbus RTU | LoRa 868/915 MHz + RS-485 | RS-485 ×4, 4G LTE, Ethernet, LoRa | RS-485 Modbus RTU | RS-485 Modbus RTU | RS-485 Modbus RTU |
| Power Supply | 12–24V DC (2W typical) | Solar 5W + LiPo 10,000 mAh | 9–36V DC (15W max) | 12–24V DC (0.5W typical) | 12–24V DC (1.5W typical) | 12–24V DC (2W typical) |
| IP Rating | IP65 (sensors), IP54 (junction box) | IP67 (fully sealed) | IP65 (metal enclosure) | IP68 (buried installation) | IP65 (indoor/outdoor) | IP68 (submersible to 10m) |
| Operating Temp. | -40°C to +60°C | -20°C to +55°C | -20°C to +60°C | -20°C to +60°C | -10°C to +50°C | 0°C to +50°C |
| Calibration Interval | 12 months (wind sensors) | 12 months (soil sensors) | N/A | 12–24 months | 12 months (NDIR auto-cal) | 1–4 weeks (biofouling) |
| Modbus RTU | Yes | Yes | Yes (master) | Yes | Yes | Yes |
| Solar Power Option | Optional | Built-in | Optional | No | No | No |
| Data Logger | Optional (SD) | Yes (internal) | Yes (SD card) | No | No | No |
| Typical Price Range | $800–$3,000 | $150–$400 | $300–$800 | $80–$250 | $120–$350 | $400–$1,200 |
| Primary Application | Reference weather, ET₀ calc | Distributed field monitoring | Central data hub, control | Precision irrigation, soil health | Greenhouse CO₂ control | Aquaculture, hydroponics |
5.4 Sensor Selection Decision Matrix
The selection of specific sensors for each deployment must be driven by the crop's critical environmental parameters, the required measurement accuracy, and the available budget. The following decision matrix maps crop types to their priority sensor requirements, providing a structured starting point for sensor selection.
| Crop / Application | Priority 1 Sensor | Priority 2 Sensor | Priority 3 Sensor | Optional Sensors |
|---|---|---|---|---|
| Greenhouse vegetables | CO₂ sensor | T/RH sensor (canopy) | Soil VWC/EC probe | PPFD sensor, leaf wetness |
| Open-field grain crops | Soil VWC (multi-depth) | Weather station | Rain gauge | Leaf wetness, wind sensor |
| Orchard / fruit trees | Frost sensor (canopy T) | Leaf wetness sensor | Soil VWC (root zone) | Wind speed, solar radiation |
| Aquaculture ponds | Dissolved oxygen probe | pH sensor | Water temperature | Turbidity, NH₃-N, water level |
| Vertical farm / hydro | CO₂ sensor | PPFD sensor | EC/pH (nutrient solution) | T/RH per tier, DO (hydro) |
| Pasture / livestock | Weather station (full) | Solar radiation | Wind speed/direction | Soil moisture, water level |
| Rice paddy | Water level sensor | Water temperature | Weather station | Soil temperature, rain gauge |
| Tea garden | T/RH (canopy) | Leaf wetness sensor | Soil moisture | Fog sensor, solar radiation |
Selection Tip: Always start with the minimum viable sensor set (Priority 1 + 2) and expand based on operational experience. Over-instrumentation in the first year leads to data overload and poor alarm management. Add sensors incrementally as the team develops the capacity to act on the additional data.