Chapter 7: Support & Integration
Supporting systems, third-party integrations, power infrastructure, network dependencies, and inter-system interface requirements for smart agriculture monitoring deployments.
7.1 Supporting Systems Overview
A smart agriculture environmental monitoring system does not operate in isolation. It depends on and integrates with a broad ecosystem of supporting systems that provide power, connectivity, control actuation, data management, and maintenance services. Understanding these dependencies is critical for system design, as a failure in any supporting system can cascade to affect monitoring availability and crop safety. The diagram below presents all eight major supporting system categories and their integration relationships with the central monitoring platform.
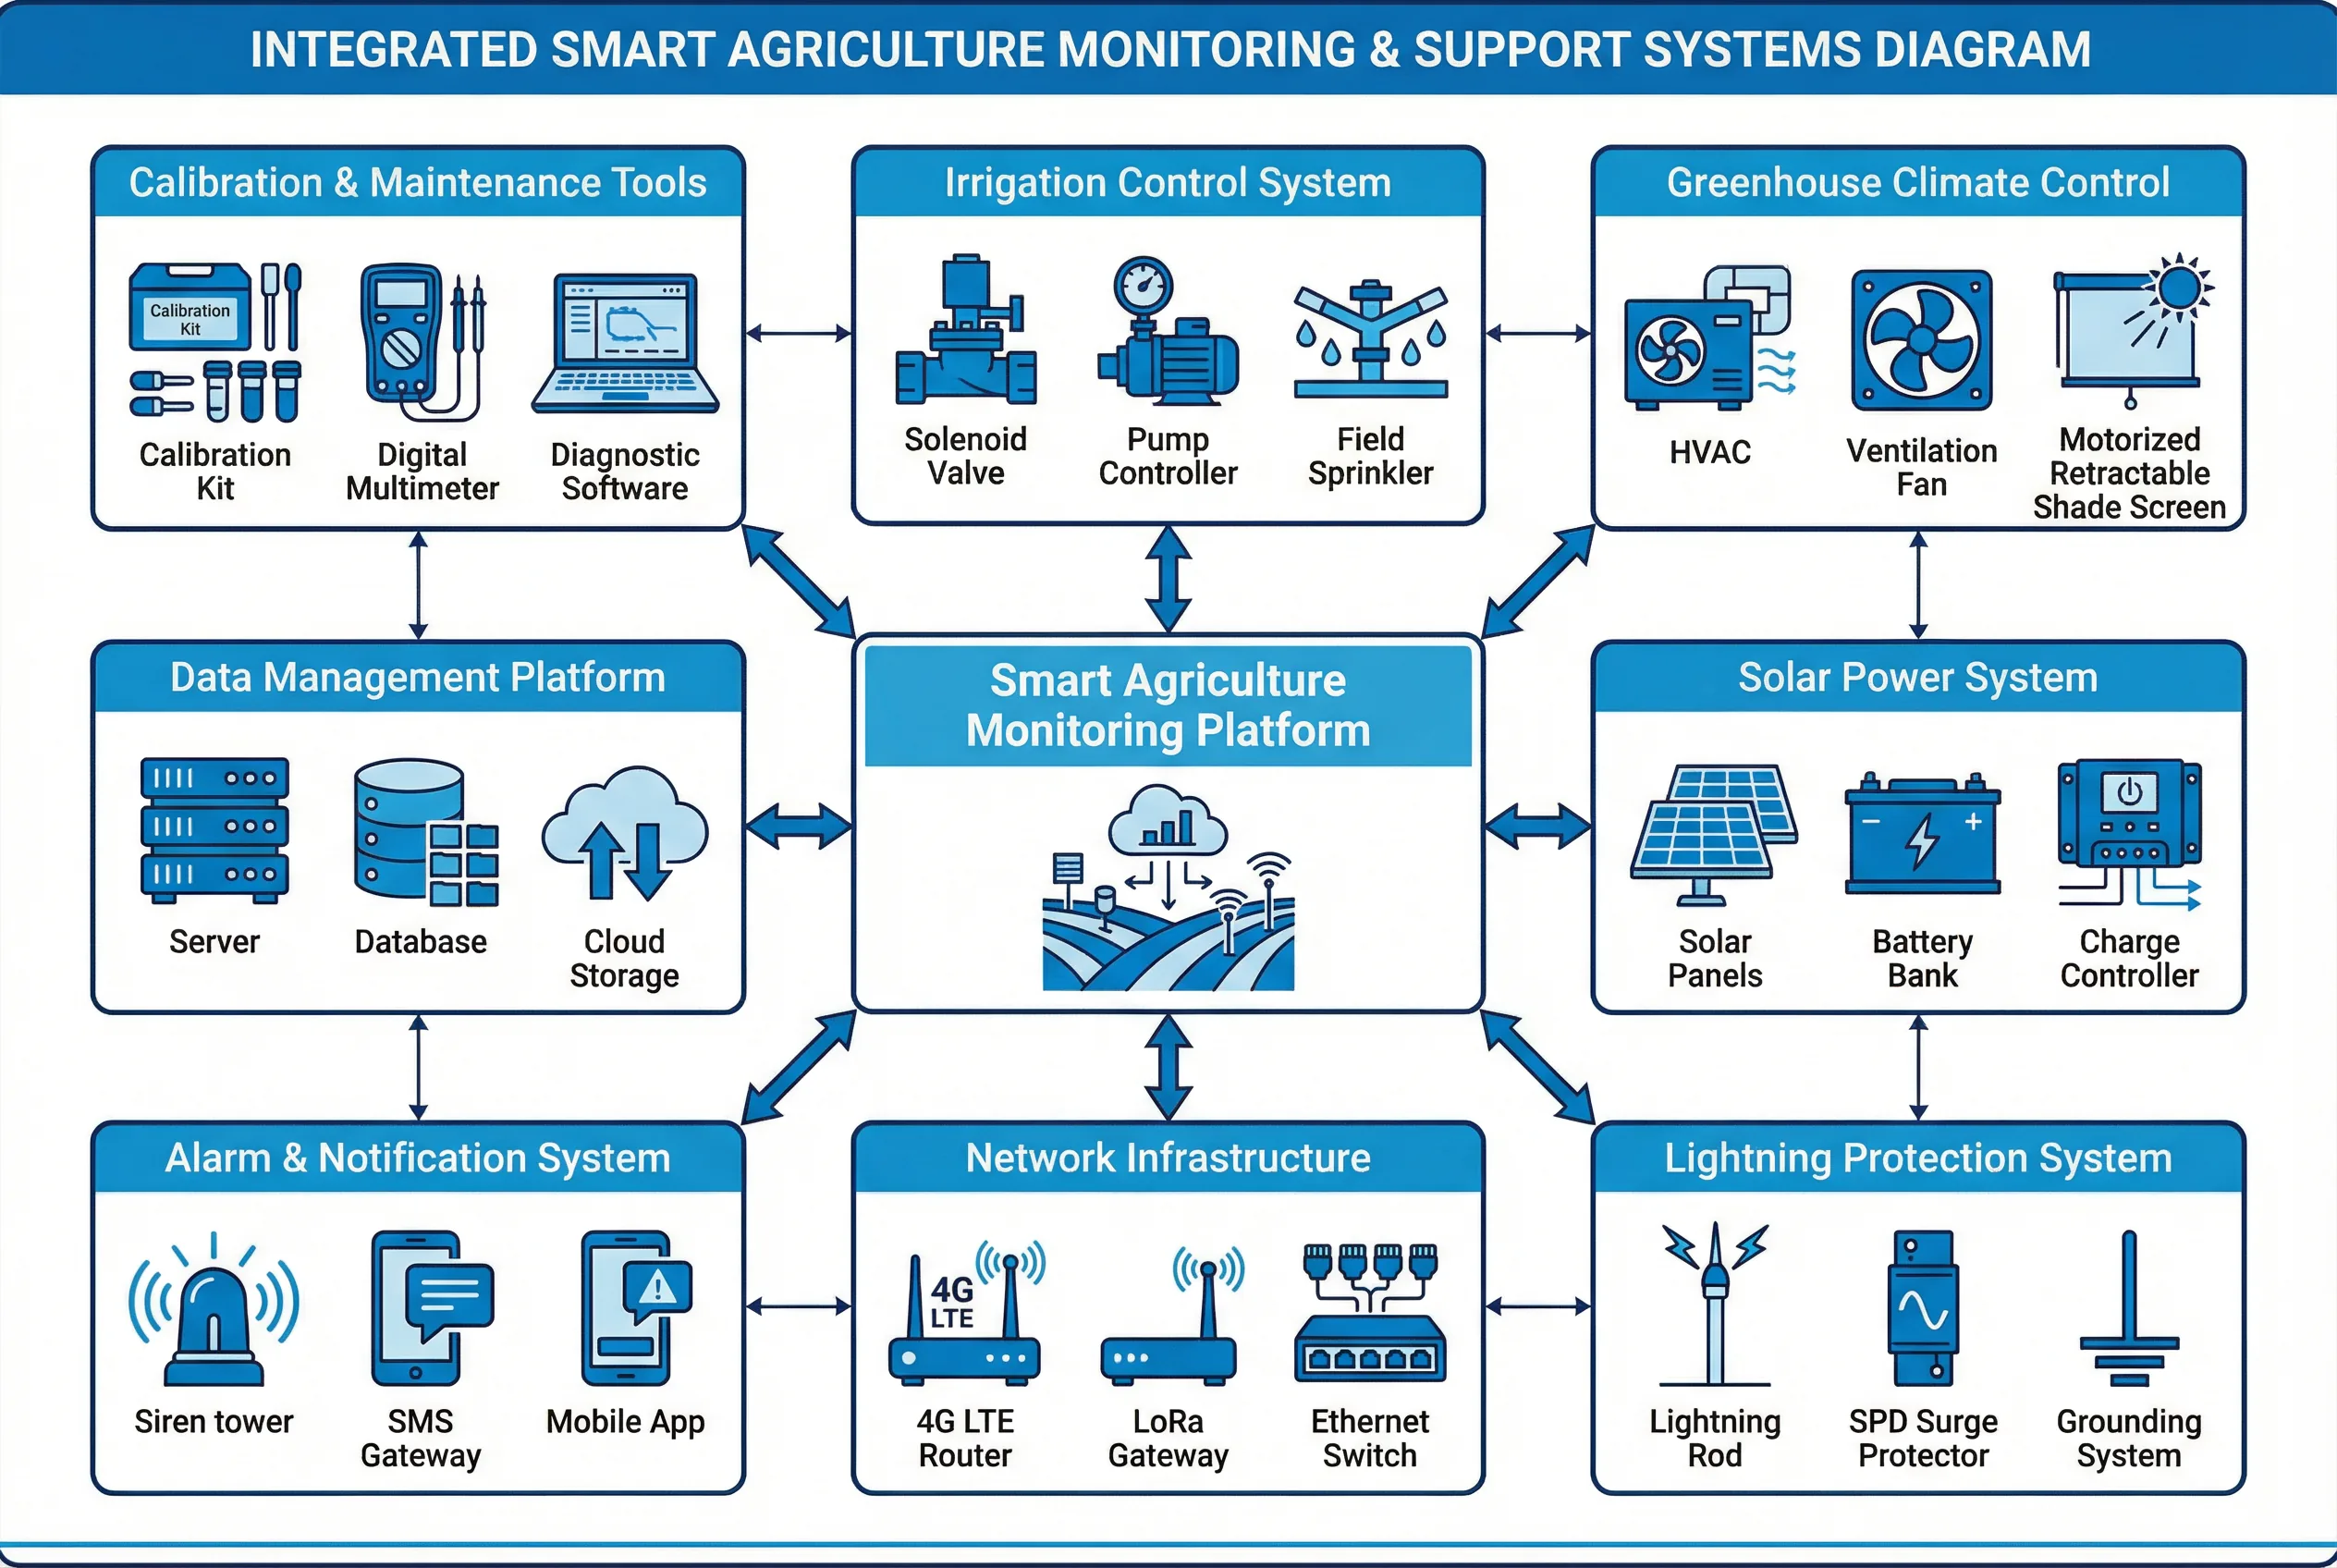
Figure 7.1: Integrated Supporting Systems Diagram — All Eight Supporting System Categories and Their Integration with the Smart Agriculture Monitoring Platform
7.2 Irrigation Control System Integration
Irrigation control is the most common actuator integration for agricultural monitoring systems. The monitoring system provides soil moisture and weather data to drive irrigation scheduling decisions, while the irrigation controller executes valve and pump commands. Integration can be achieved at three levels of sophistication, each with different requirements and capabilities.
| Integration Level | Description | Interface Method | Monitoring System Role | Typical Use Case |
|---|---|---|---|---|
| Level 1 — Data Only | Monitoring provides data; irrigation controller makes decisions independently | Manual data review | Data display and alarm | Small farms, simple systems |
| Level 2 — Alarm-Triggered | Monitoring triggers irrigation start/stop via dry contact relay when soil VWC crosses threshold | Relay output to irrigation controller input | Threshold alarm + relay control | Medium farms, single-zone irrigation |
| Level 3 — Full Integration | Monitoring platform communicates directly with irrigation controller via Modbus or API, enabling multi-zone, ET₀-based scheduling | Modbus RTU / TCP or REST API | Irrigation schedule calculation and command | Large farms, precision irrigation |
7.3 Solar Power System Design Requirements
For off-grid monitoring nodes, the solar power system is the most critical supporting infrastructure. Undersized solar systems are the leading cause of monitoring node downtime in the first year of operation. The power system must be designed for the worst-case solar irradiance conditions at the deployment location, typically the winter solstice with 3–5 consecutive cloudy days.
7.3.1 Solar System Sizing Parameters
| Parameter | Typical Value | Design Rule | Notes |
|---|---|---|---|
| Node power consumption | 0.5–2W average (LoRa node) | Measure actual consumption at target reporting interval | Includes sensor power, MCU, radio duty cycle |
| Daily energy consumption | 12–48 Wh/day | Consumption × 24 hours | Use 15-min reporting interval for calculation |
| Peak sun hours (PSH) | 3–6 hours/day (location-dependent) | Use worst-month PSH from NASA POWER database | Use 3 PSH for conservative design in temperate climates |
| Solar panel size | 10–30W | Daily energy / PSH × 1.3 (derating factor) | 1.3 factor accounts for dust, temperature, aging |
| Battery capacity | 20–100 Ah (12V) | Daily energy × autonomy days / (0.8 × battery voltage) | 0.8 = 80% DoD limit for LiFePO4; 0.5 for lead-acid |
| Autonomy days | 5–7 days | Minimum 5 days for temperate climates; 7 days for high-latitude | Covers consecutive cloudy weather periods |
| Charge controller | MPPT type | MPPT preferred over PWM for efficiency in partial shade | Size to 1.25× panel short-circuit current |
7.4 Lightning Protection System Requirements
Lightning protection is mandatory for any monitoring installation with mast heights exceeding 2 meters in open terrain. Agricultural monitoring stations are particularly vulnerable because they are often the tallest structures in flat fields. A direct lightning strike on an unprotected station will destroy all electronics and may damage the gateway and connected sensors through conducted surge energy.
- Install a lightning rod (air terminal) at the top of each sensor mast, extending at least 300 mm above the highest sensor
- Connect the lightning rod to a ground rod (minimum 1.5 m deep, copper-clad steel) via a 16 mm² copper conductor
- Install Type 2 SPD (surge protection device) on all power supply lines entering the enclosure (IEC 61643-11)
- Install Type 2 SPD on all RS-485 communication lines entering the enclosure (IEC 61643-21)
- Measure ground resistance after installation: target <10 Ω; <4 Ω for high-lightning-risk areas
- Bond all metal enclosures, masts, and cable trays to the same grounding point
- Use shielded cable for all RS-485 runs, with shield grounded at the gateway end only
7.5 Network Infrastructure Dependencies
The monitoring system's connectivity depends on network infrastructure that may be partially or wholly outside the farm operator's control. Understanding these dependencies and designing appropriate fallback mechanisms is essential for maintaining monitoring availability during network outages.
| Network Component | Dependency Level | Typical Outage Frequency | Fallback Mechanism | Maximum Acceptable Downtime |
|---|---|---|---|---|
| 4G LTE carrier network | High (primary backhaul) | 2–5 hours/month | Dual-SIM, LoRa local alarm | 4 hours (non-critical); 15 min (aquaculture) |
| Internet (cloud platform) | High (data storage, alarms) | 1–3 hours/month | Local edge storage, SMS alarm | 24 hours (data); 15 min (alarms) |
| LoRa network (field nodes) | Medium (field data) | Variable (RF conditions) | Retry with backoff, local node buffer | 1 hour |
| Grid power (gateway) | Critical (greenhouse) | 2–8 hours/year | UPS backup, minimum 4-hour runtime | 0 (continuous operation required) |
| DNS / NTP servers | Low (time sync) | Rare | Local RTC battery backup | 72 hours (RTC drift acceptable) |
7.6 Third-Party Platform Integration
Modern agricultural operations increasingly require integration between the monitoring system and other farm management platforms, including farm management information systems (FMIS), ERP systems, weather forecast services, and precision agriculture decision support tools. The monitoring system must expose standard APIs to enable these integrations without requiring custom development for each connection.
Integration Standard: All monitoring platforms should support REST API with JSON data format, MQTT protocol for real-time data streaming, and CSV/Excel export for historical data. These three interfaces cover 95% of third-party integration requirements in commercial agriculture.
| Integration Type | Platform Examples | Interface Method | Data Exchanged | Update Frequency |
|---|---|---|---|---|
| Farm Management (FMIS) | Trimble Ag, John Deere Ops Center, Climate FieldView | REST API / OAuth 2.0 | Sensor data, alerts, field boundaries | 15–60 min |
| Weather Forecast | DTN, Weather Underground, OpenWeatherMap | REST API | Forecast data for ET₀ calculation | 1–6 hours |
| Irrigation Controller | Netafim, Hunter, Rain Bird | Modbus TCP / REST API | Soil VWC, ET₀, irrigation commands | Real-time / 15 min |
| ERP / Accounting | SAP, Oracle, QuickBooks | REST API / CSV export | Crop yield data, resource usage | Daily |
| Regulatory Reporting | Government ag databases | CSV / XML export | Water usage, pesticide application records | Monthly / annual |